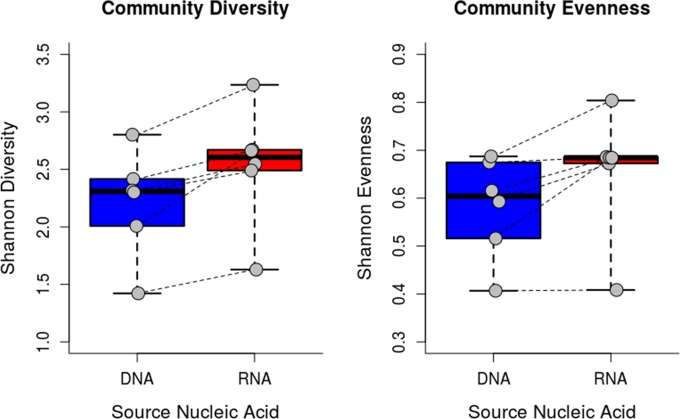
FIG 4.
Shannon diversity and evenness indices of DNA and RNA but gene sequences, with communities from the same pig joined by a dotted line. The horizontal line within the box indicates the median, the boundaries of the box indicate the 25th and 75th percentiles, the whiskers extend to the minimum and maximum values, and individual data points are represented by gray circles.

