
Figure 4.
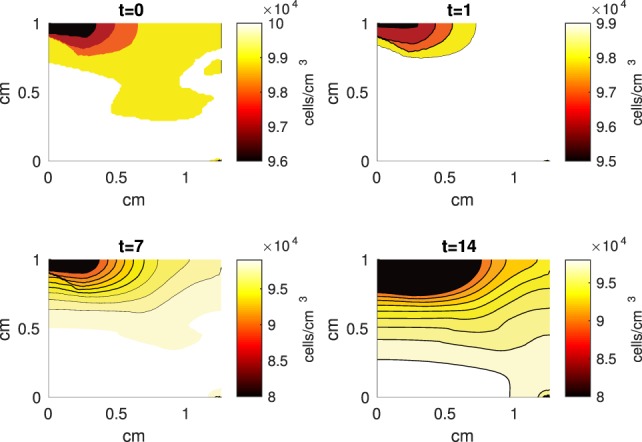
A contour graph of the density of the normal healthy cells (CU) in the 2D model at 0, 1, 7, and 14 days. The contour plot shows the decrease of CU cell density in the rectangular representation of the cylindrical explant. The lowest number of cells is in the upper left corner, the area of the initial contact. The units are cells/cm3.