Figure 7.

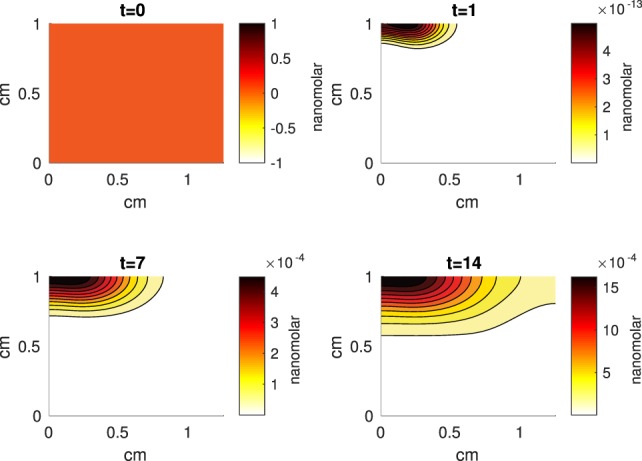
A contour graph of the concentration of erythropoietin (EPO) in the 2D model at 0, 1, 7, and 14 days. The units are nanomolar.

A contour graph of the concentration of erythropoietin (EPO) in the 2D model at 0, 1, 7, and 14 days. The units are nanomolar.