
Figure 8.
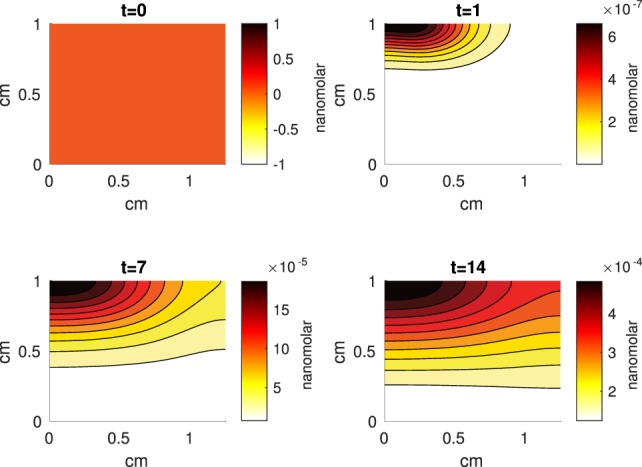
A contour graph of the concentration of pro-inflammatory cytokines (PIC) in the 2D model at 0, 1, 7, and 14 days. The units are nanomolar.
Official websites use .gov
A
.gov website belongs to an official
government organization in the United States.
Secure .gov websites use HTTPS
A lock (
) or https:// means you've safely
connected to the .gov website. Share sensitive
information only on official, secure websites.
A contour graph of the concentration of pro-inflammatory cytokines (PIC) in the 2D model at 0, 1, 7, and 14 days. The units are nanomolar.