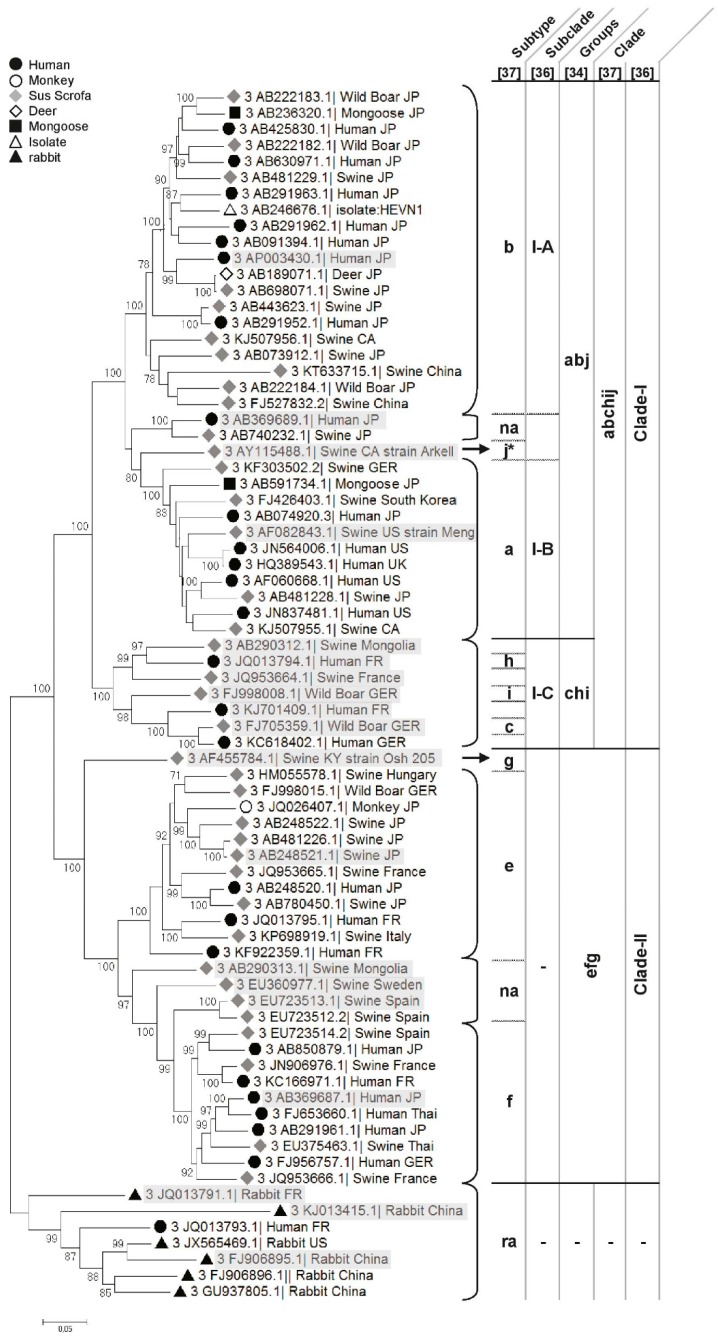
Figure 2.
Phylogenetic tree of HEV-3. The tree was inferred using the Maximum Likelihood method based on the Tamura–Nei model. The analysis involved the 75 most representative HEV-3 complete sequences/cds available on the GenBank database and aligned using the clustal W method. The bootstraps were obtained from 1000 replicates and values >70% are indicated. The initial tree was obtained by applying the Neighbour-Joining method to a matrix of pairwise distances estimated using the MCL approach. The tree is drawn to scale, with branch lengths proportional to the number of substitutions per site. Evolutionary analyses were conducted using Molecular Evolutionary Genetics Analysis (Version 6.0). Cluster names from the classification proposed by Lu et al., Vina-Rodrigues et al. and Smith et al. (letters a to j and ra cluster) are indicated in the table on the right side of the tree [35,38,39] and by Mirazo et al. (Clade-I and -II and subclades I-A to I-C) [37]. Reference sequences of the different HEV subtypes used by Smith et al. [38] are highlighted in grey. The symbols to the left of the different HEV strains indicate the host of origin. na = non assigned.

