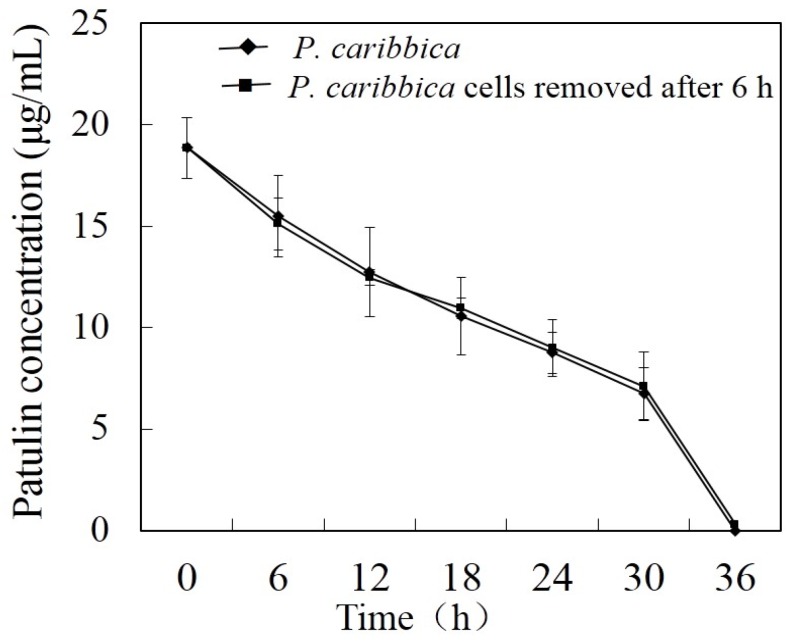
Figure 4.
Efficacy of cell-free filtrate of P. caribbica which was induced 6 h by patulin on degradation of patulin. The x axis represents the time after the addition of patulin (h: hour), the y axis represents the concentration of the patulin in the medium. Results are presented as means ± SD of triplicate experiments. The data at the same time were analyzed by the t test. The significant difference was assessed at the level p < 0.05.

