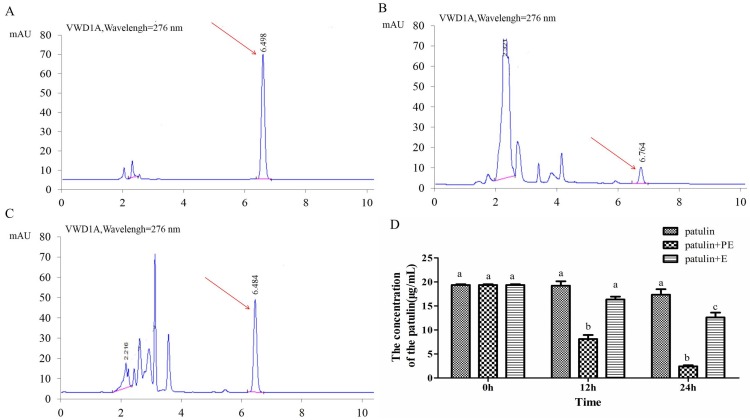
Figure 5.
Effects of intracellular enzymes of P. caribbica on degradation of patulin. (A): The HPLC result of standard patulin samples in phosphate buffer at 24 h after incubation; (B): The HPLC result of patulin+P-E (extracted from the P. caribbica induced by patulin);(C): The HPLC result of patulin+E (extracted from P. caribbica); (D): The patulin content at 0, 12, and 24 h after treatment. The red arrows in A, B, and C represent the peaks of patulin. The data are presented as means ± SD of triplicate experiments. The data at the same time were analyzed by the analysis of variance (ANOVA) in the statistical program SPSS/PC version 17.0. The significant difference was assessed at the level p < 0.05.

