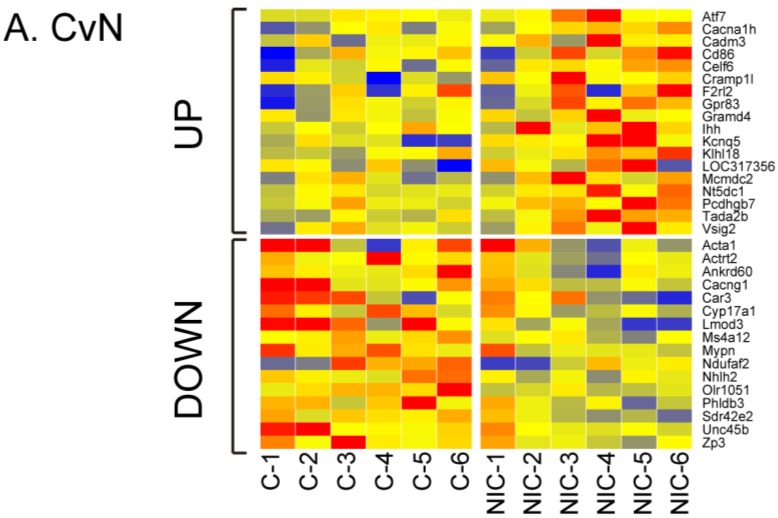
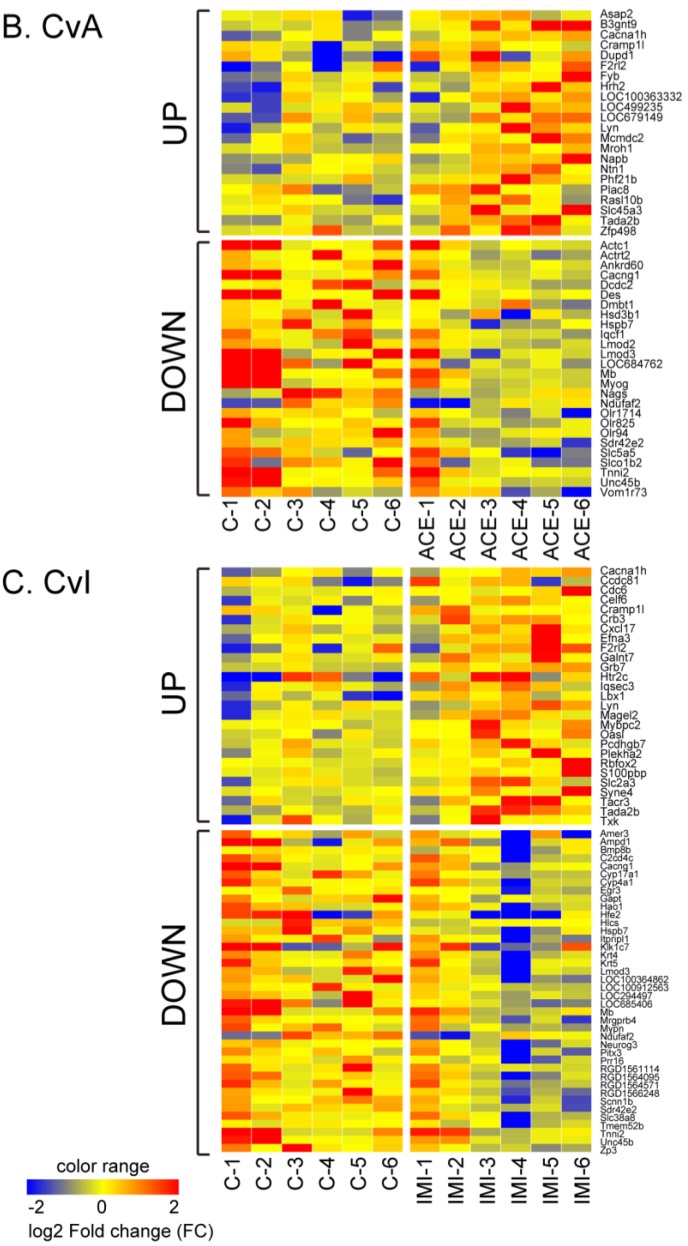
Figure 4.
Heat maps of differentially expressed for control versus NIC (A), ACE (B), or IMI (C) (CvN, CvA, and CvI, respectively) from each of the six experiments (x-axis). Gene probes are listed alphabetically on the y-axis. Color change represents magnitude of log2 fold change (−2 (blue) to 2 (red)).


