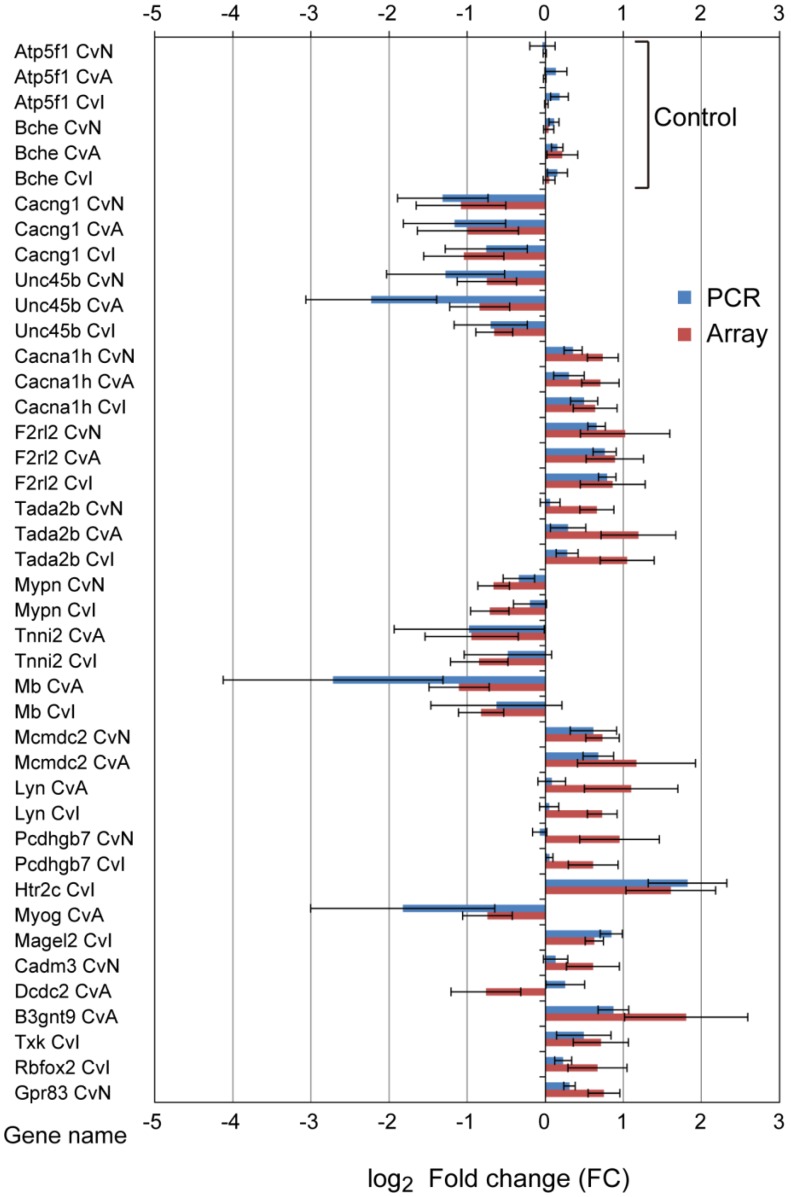
Figure 5.
Confirmation of the microarray data using quantitative real-time PCR (qRT-PCR). Twenty DE genes and two control genes were selected at random for validation. Red bars, microarray data; blue bars, qRT-PCR data. The qRT-PCR data were normalized against the reference gene Actb; similar results were obtained using Gapdh as reference (not shown). The similarity of the expression patterns (up- and downregulation) between the microarray and qRT-PCR analyses confirmed the results of the microarray. Error bars represent standard errors from six experiments. Control genes’ descriptions are follows; Atp5f1, ATP synthase, H+ transporting, mitochondrial Fo complex, subunit B1; Bche, butyrylcholinesterase.

