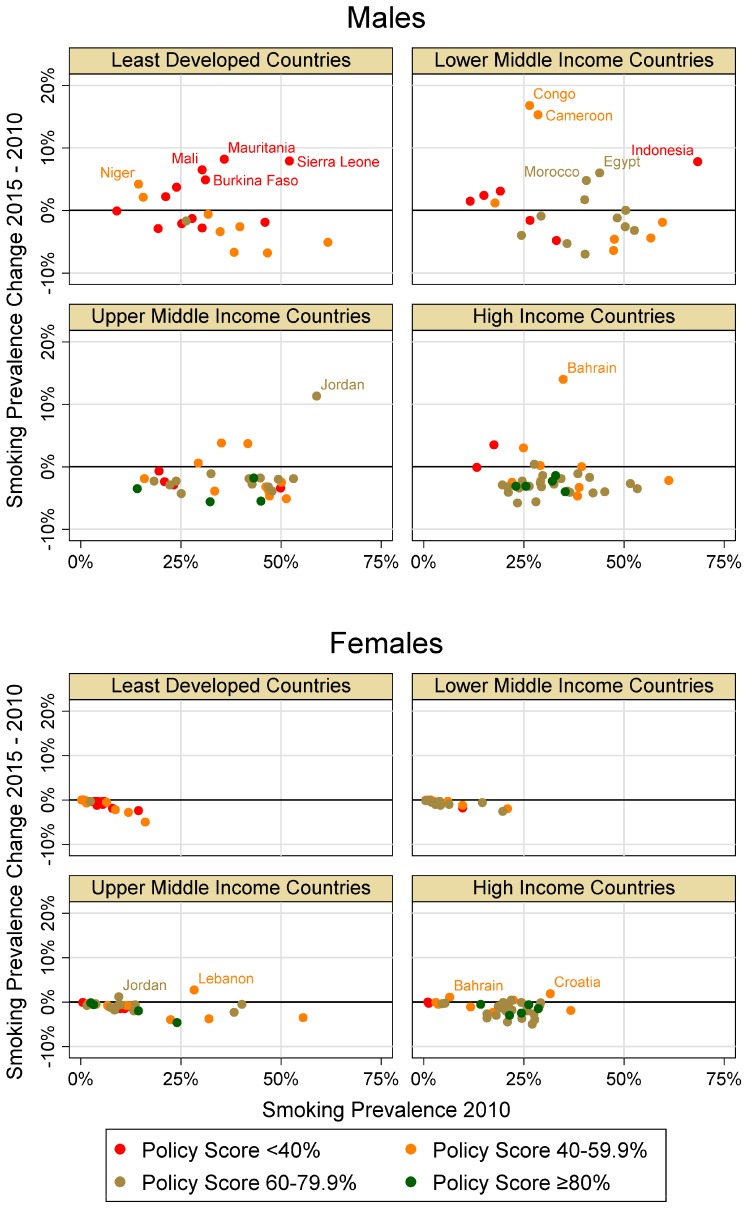
Figure 2.
Relationship between combined policy percentage scores (PS) of 2010 and change in current tobacco smoking between 2010 and 2015 in relation to smoking prevalence in 2010 by gender and country income category (labeled data points indicate countries with a smoking prevalence change of >4% for males and >1% for females; Congo = Republic of Congo).

