
Figure 5.
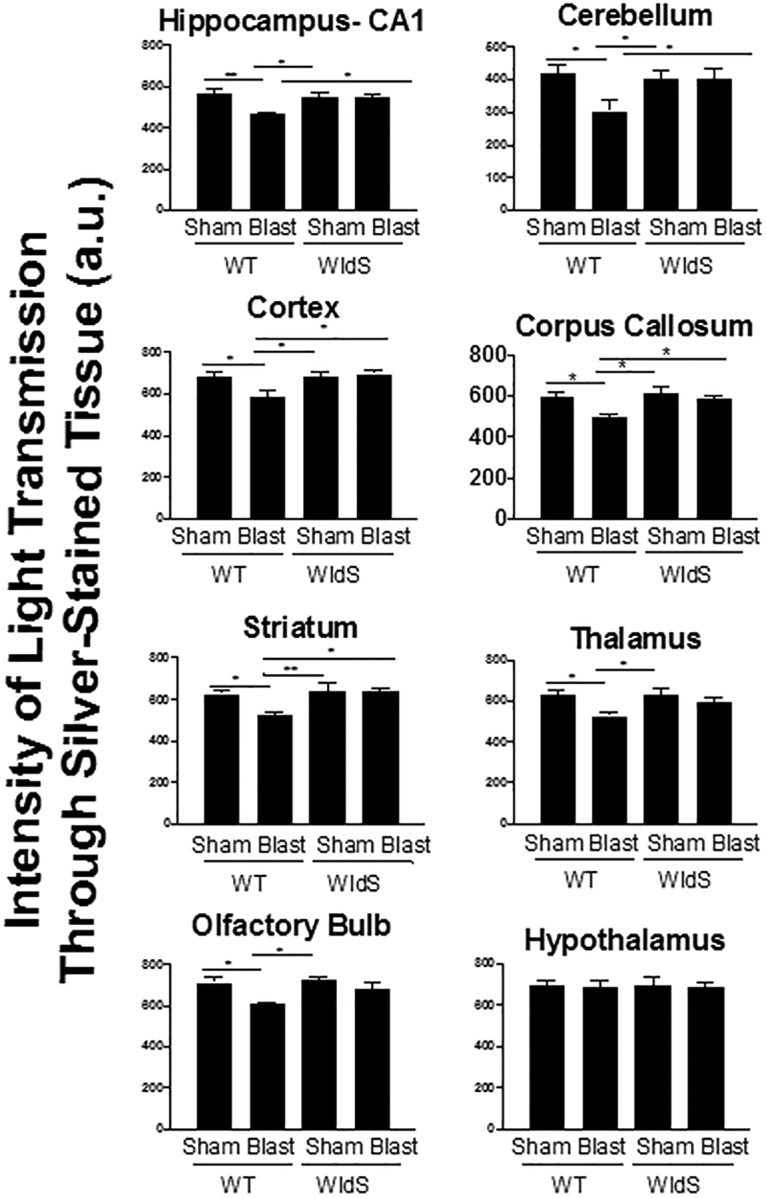
Optical densitometry of light transmitted through silver-stained brain regions from all animals in each group was used to quantify the protective effect. Signal was quantified for 18 sections for each of the five animals, spaced 480 mm apart. Here, a greater value indicates that more light was able to pass unimpeded through the section by virtue of less silver staining, which reflects less axonal degeneration. Data are represented as mean ± SEM. p-value *<0.05 and **<0.01 determined by two-way ANOVA with Bonferroni post hoc analysis compared with blast-injured WT animals.