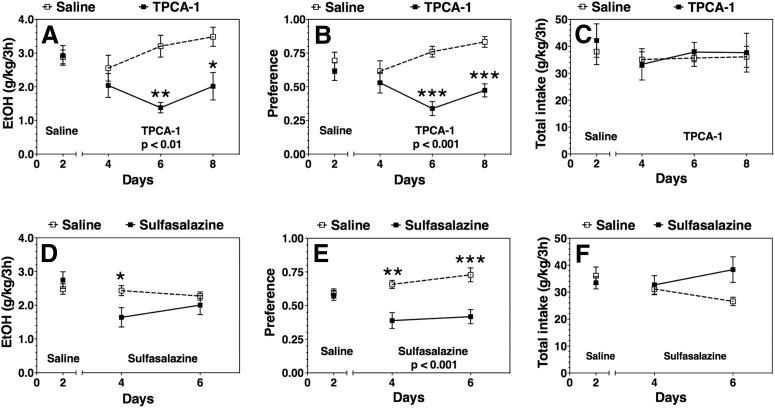
Figure 2.
Effect of IKKβ inhibitors on ethanol (EtOH) intake and preference after 3 h in a limited access two-bottle choice drinking-in-the-dark test in C57BL/6J mice. A–C, 50 mg/kg TPCA-1 vs saline treated (n = 6 per group). D–F, 100 mg/kg sulfasalazine vs saline treated (n = 8 per group). A, D, 15% ethanol consumption (g/kg/3 h). B, E, Preference for ethanol. C, F, Total fluid intake (g/kg/3 h). Day 2 in each panel shows the averages of 2 d of saline injections for each group ± SEM. Remaining time points are the 2 d drinking averages in the presence of saline or drug ± SEM. Significant main effect of drug treatment is shown by the p value (two-way ANOVA with repeated measures). Significant post hoc effect of each drug compared with the corresponding saline group is indicated by the symbols above each time point (Bonferroni test for multiple comparisons, *p < 0.05, **p < 0.01, ***p < 0.001).

