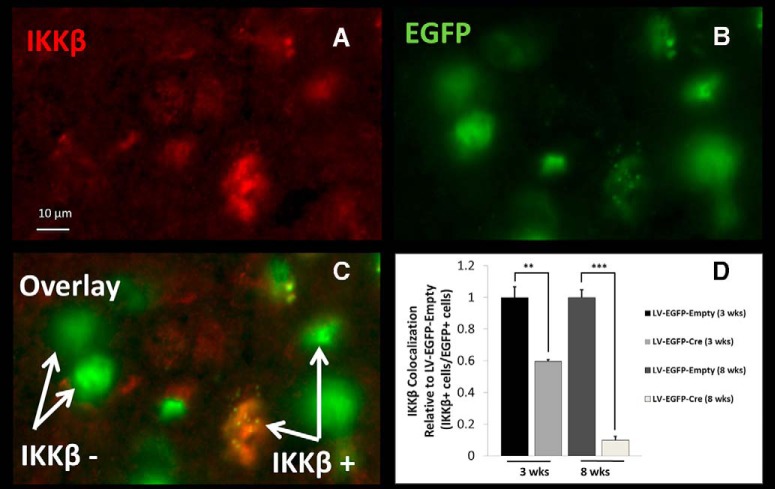
Figure 3.
IKKβ protein knockdown (3 and 8 weeks post-injection) in NAc of IkkbF/F mice. A fluorescent light microscope image of a representative stain from the 3 week post-injection time point in NAc is shown. A, Anti-IKKβ fluorescently labeled antibody. B, Anti-EGFP fluorescently labeled antibody. C, Overlay of A and B (“IKKβ–” represents transduced cells without IKKβ, and “IKKβ+” represents transduced cells with IKKβ). D, Knockdown of IKKβ (LV-EGFP-Cre) measured by IKKβ-positive cells colocalized with EGFP-positive cells relative to their time-matched control (LV-EGFP-Empty). The mean ± SEM of eight fields of view (20×) per mouse for four mice are shown (n = 4 for each group: 3 weeks after LV-EGFP-Cre, 3 weeks after LV-EGFP-Empty, 8 weeks after LV-EGFP-Cre, 8 weeks after LV-EGFP-Empty). Student’s t test: **p < 0.01, ***p < 0.001.

