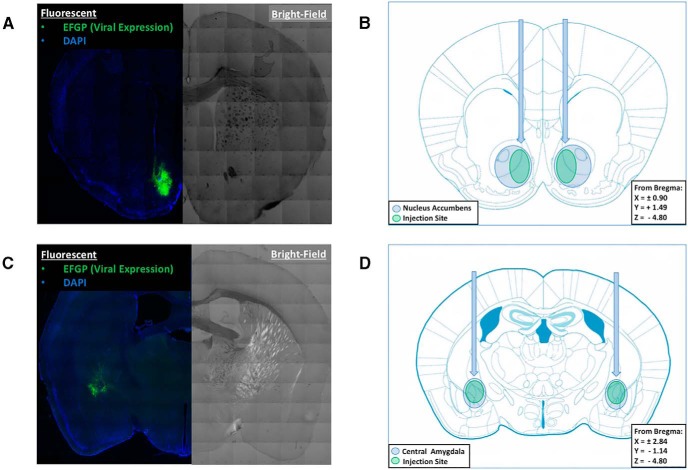
Figure 7.
Injection target verification of lentiviral-mediated IKKβ knockdown in the NAc and CeA. A, C, Composite microscope images of a coronal section in the NAc (A) or CeA (C) of a representative lentiviral injection using fluorescent microscopy (on left) to show EGFP marker signal (green) and bright-field (on right) to demonstrate neuroanatomy. B, D, Coronal brain atlas figures of the injection sites with blue circles indicating the NAc (B) or CeA (D), and the green ovals illustrating the typical lentiviral injection location and spread.

