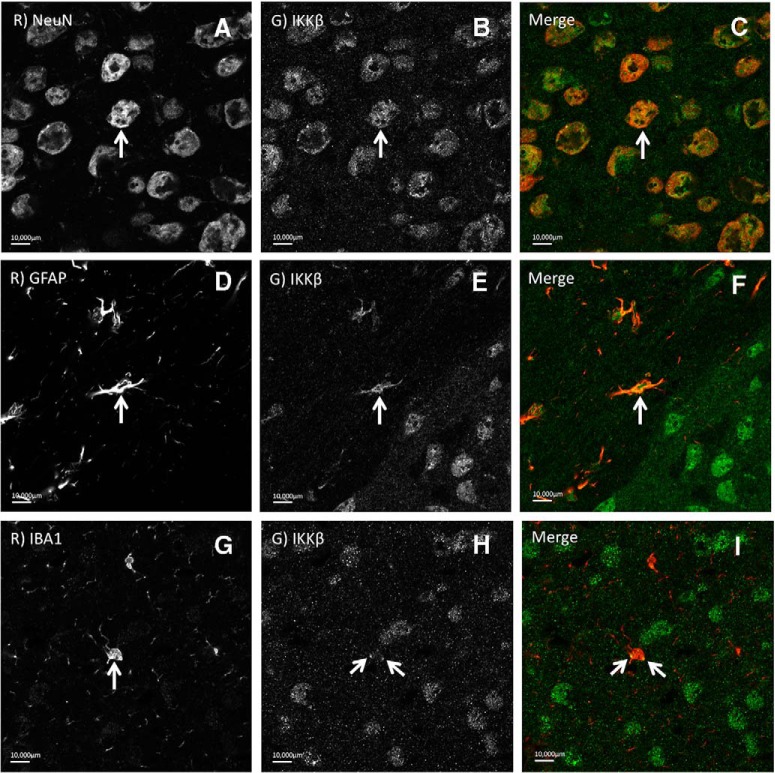
Figure 9.
Cell type-specific localization of IKKβ in the NAc and CeA. A–I, Representative fluorescent light microscope images illustrating cell type-specific antibodies in the first columns [anti-NeuN for neurons (A); anti-GFAP for astrocytes (D); anti-IBA1 for microglia (G)], anti-IKKβ stains in the second columns (B, E, H), and overlay of the first two in the third columns (C, F, I). Arrows illustrate cells showing colocalization of anti-IKKβ and cell type-specific stains.

