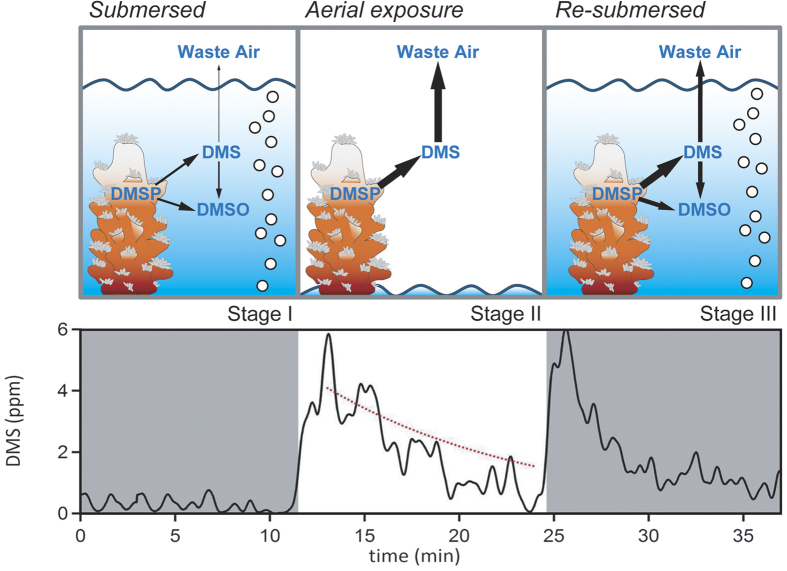
Figure 1. Conceptual diagram of dimethylated sulfur cycling in the presence of coral when submersed (Stage I), during air exposure (Stage II) and when re-submersed (Stage III).
Upper panel shows experimental approach with arrow sizes indicating relative strength of production pathways. Lower panel shows high-frequency measurements (black line) of DMSgas in the outflow of a flask containing the coral Acropora cf. horrida400 before, during and after air exposure. The red dashed line shows the calculated loss rate due to flushing of the flask.

