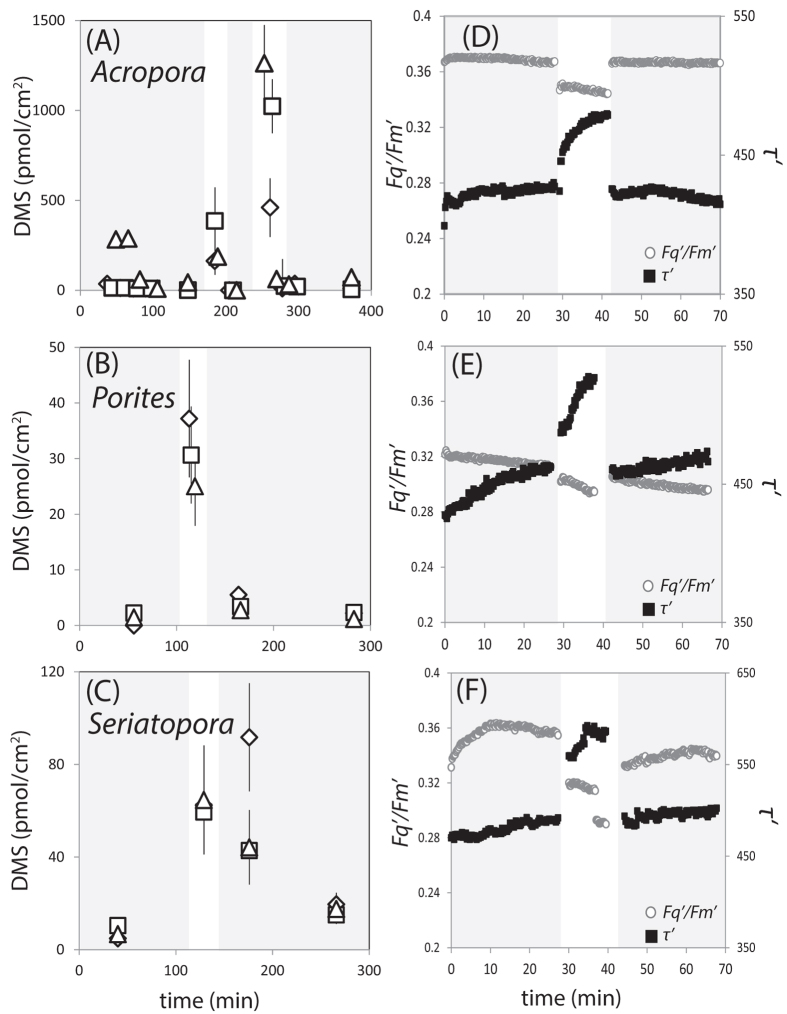
Figure 2.
Coral surface area- normalised DMS concentrations (pmol/cm2) in the outflow from triplicate coral experimental flasks (A–C) and photosynthetic performance (D–F) of coral before, during and after air exposure. Grey shaded areas = coral submersed (Stage I and III), white areas = coral exposed to air (Stage II). Acropora cf. horrida400 (A,D), Porites cylindrica400 (B,E) and Seriatopora hystrix100 (C,F). Experiments were run in triplicate and replicate flasks are distinguished by different symbols (Flask 1 = diamonds, Flask 2 = squares, Flask 3 = triangles). Error bars on Panel A represent the total measurement error which includes error associated with 5 min-averaged 0.25 Hz API-CIMS measurements (see Methods), coral surface area measurements and flow rate of culture aeration. Superscript numbers = light acclimation levels in μmol m−2 s−1. * = discrete measurements made by GC-FPD.

