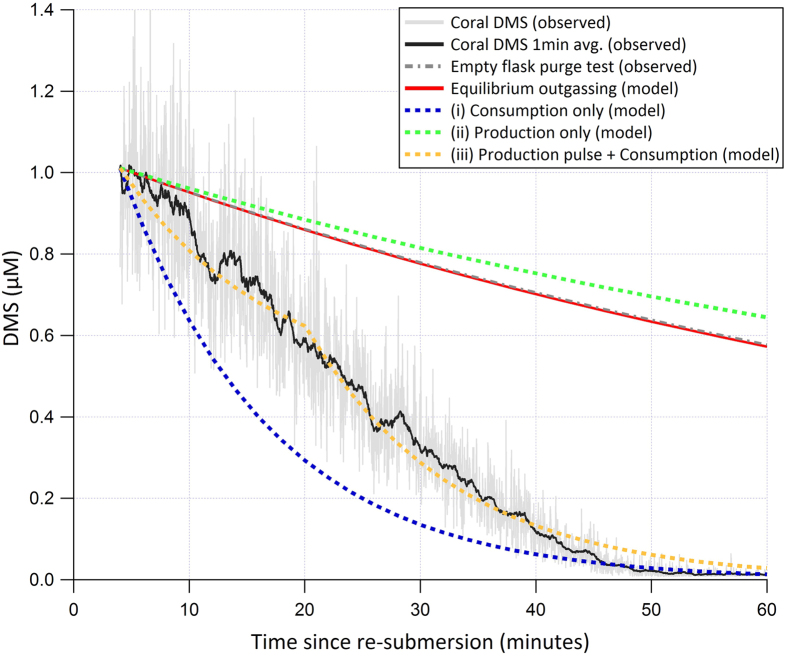
Figure 4. Observations and model results for DMSsw in an experimental flask holding an Acropora cf. horrida colony.
API-CIMS measurements (black line: 1 min average) commenced upon coral re-submersion following 16 min of exposure to air (Stage III). Grey dashed line represents the exponential loss of DMS due to bubbling based on measurements made in a coral-free flask derived during a separate experiment. The red line shows the calculated loss rate due to equilibrium outgassing. Results of model runs: (i) loss rate in absence of DMS production with a first order consumption rate of 3.7/hr (blue dashed line); (ii) zero consumption and a constant production rate of 100 nM/h (green dashed line); (iii) first order consumption rate of 3.7/hr and high production of 2 μM/h for first 15 min followed by zero production (gold dashed line).

