
Figure 2. The overall structure of colonic content microbiota of male recipient mice was separated from that of female recipient, and closer to the donor.
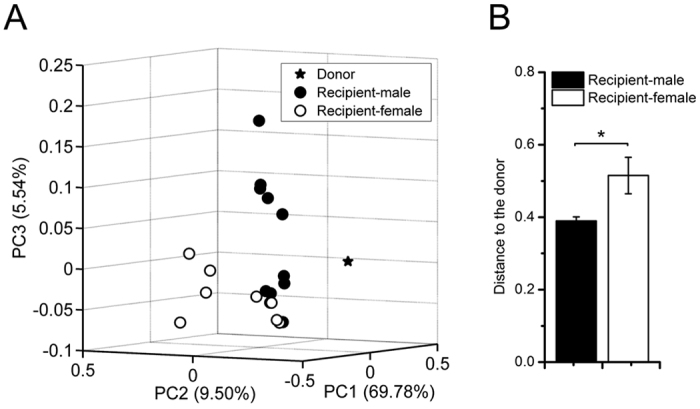
(A) PCoA score plot based on weighted UniFrac metrics. Each point represented the fecal microbiota of a mouse. (B) Weighted UniFrac distances to the donor of the two groups. Differences were assessed by Mann-Whitney test. *P < 0.05. n = 1 for Donor; n = 10 for Recipient-male group; n = 9 for Recipient-female group.