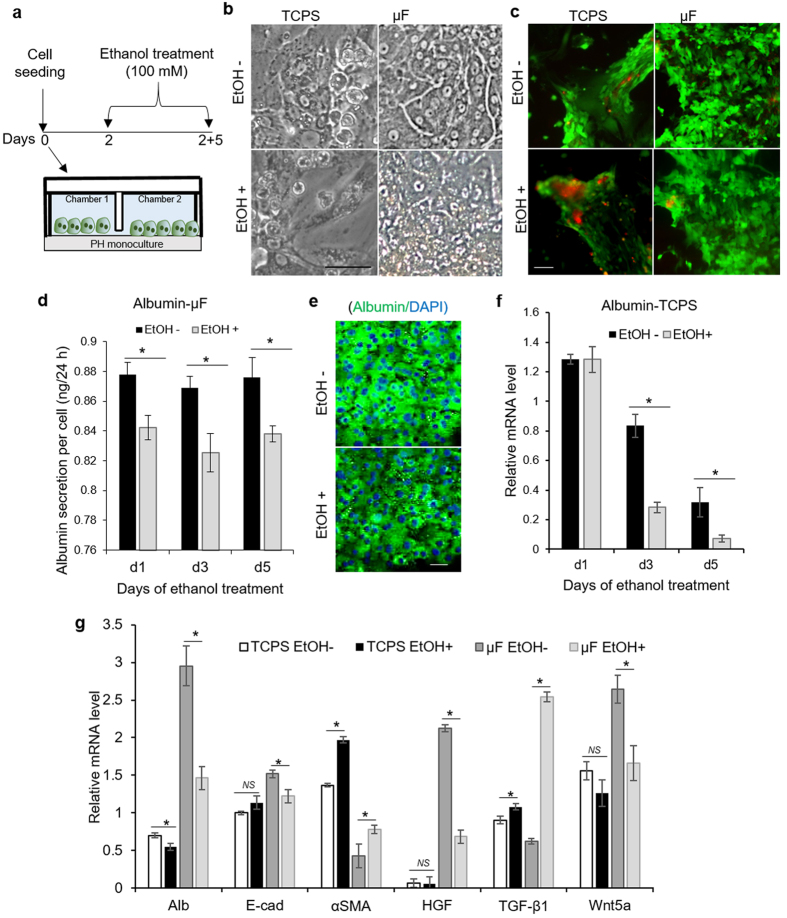
Figure 3. Response of hepatocyte to ethanol injury.
Samples were analyzed on day 7 of culture (5 days of ethanol treatment) unless otherwise mentioned. (a) Diagram describing experiment where hepatocytes are exposed to 100 mM ethanol for 5 days. (b) Brightfield microscopy of hepatocytes cultured with and without ethanol showing mesenchymal phenotype in tissue culture polystyrene (TCPS) plates and epithelial phenotype in microfluidic (μF) devices. (c) Live (green) and dead (red) cell staining showing the effect of alcohol treatment on cell viability. (d) Albumin ELISA of healthy and injured hepatocytes cultured in microfluidic devices. (e) Immunofluorescent staining showing the expression of albumin in healthy and injured hepatocytes cultured in microfluidic devices. (f) Quantitative real-time PCR analysis reveals that the expression albumin in hepatocytes cultured in TCPS plates decrease rapidly even in the absence of injury by ethanol. (g) Real-time PCR analysis of hepatic marker (Alb), epithelial and mesenchymal markers (E-cad and αSMA), and growth factors (HGF, TGF-β1, and Wnt5a). The bars represent mean ± SD (n = 3). *P < 0.05. NS: non-significant. Scale bar: 50 μm. Abbreviation: Alb, albumin; E-cad, Epithelial-cadherin; αSMA, alpha smooth muscle action; HGF, hepatocyte growth factor; TGF-β1, transcription growth factor beta-1; Wnt5a, wingless-type MMTV integration site family, member 5a; PH, primary hepatocytes.

