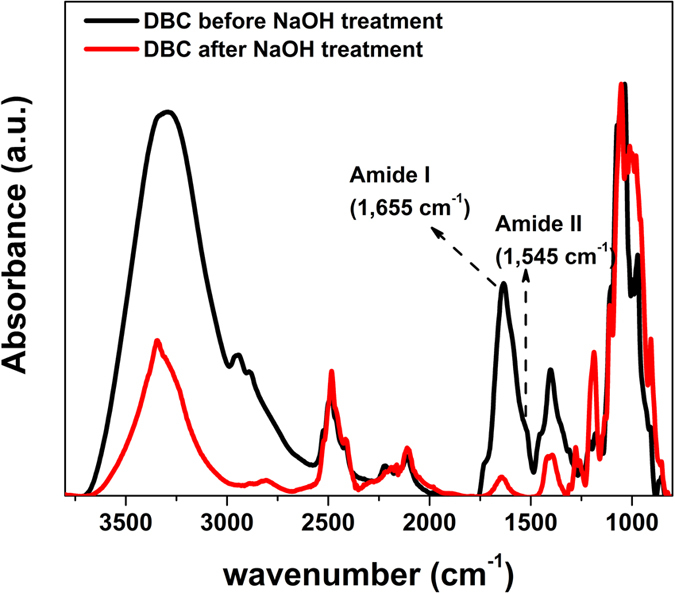
Figure 2. ATR-FTIR spectra of dried deuterated bacterial cellulose before and after NaOH treatment to remove protein and other cellular material.

The spectra are normalized to the maximum peak height for clarity of presentation.

The spectra are normalized to the maximum peak height for clarity of presentation.