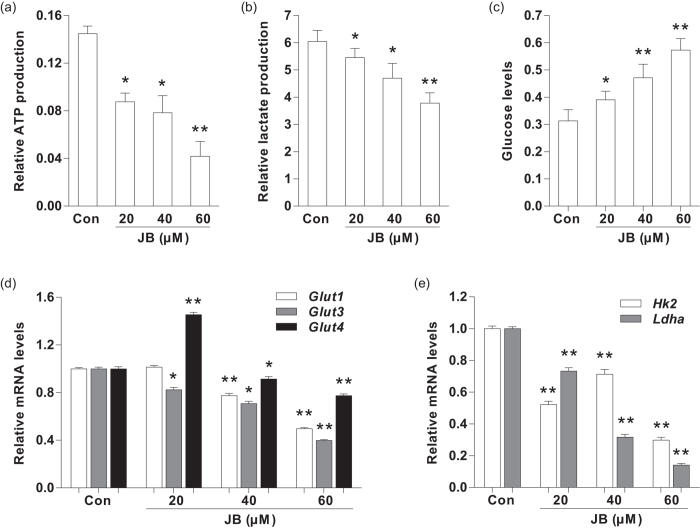
Figure 2. The effect of JB on glycolysis in B16F10 cells.
(a) The intracellular ATP production were determined after treatment with JB in B16F10 cells. (b) Detection of lactic acid content in B16F10 cell culture medium. (c) The glucose levels in B16F10 cell culture medium. (d) The mRNA expression levels of glucose transporter genes in B16F10 cells after treatment with the indicated concentrations of JB. (e) The mRNA expression levels of glycolysis-related genes in B16F10 cells treated with different concentrations of JB. Note: Data are presented as mean ± s.d. from three individual treatments. *P < 0.05, **P < 0.01 compared with control group.

