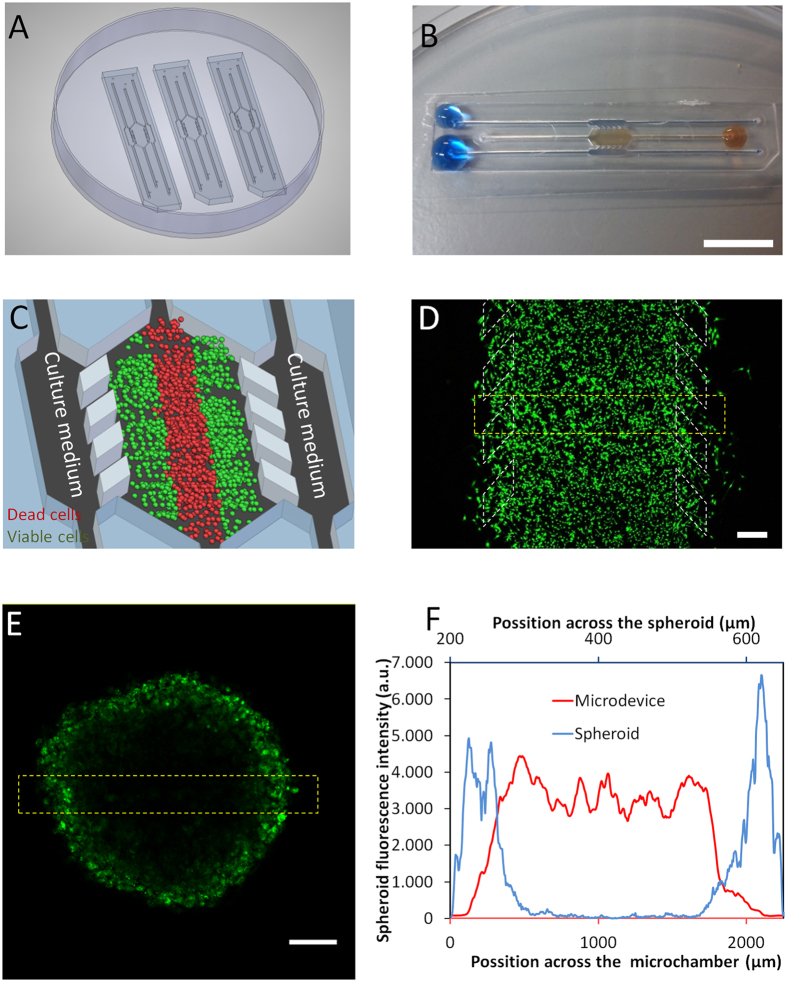
Figure 1. Microdevice operation and modelling of the tumour microenvironment.
(A) Appearance of the microdevice. Microdevices are fabricated by injection moulding and can be attached to the bottom of a Petri dish using biocompatible adhesive; three identical devices are shown. (B) Magnified image of a microdevice with collagen hydrogel confined to the central microchamber and blue-coloured water perfused through the two lateral microchannels to ease visualization. Droplets are located on top of the inlets to prevent evaporation. Scale bar is 1 cm. (C) The principle of the live ‘tumour slice’: Culture medium perfused through the lateral microchannels provides nutrients and oxygen creating physiological gradients across the device. Cells near the ‘surrogate’ blood vessels are viable, whereas oxygen-poor cells in the centre of device start to die creating a ‘necrotic core’ similar to the necrotic regions of tumours. (D) Cellular visualization in the microdevice. 20 million U-251 MG cells/ml were embedded in collagen and pipetted into the central chamber of the microdevice. Image shows appearance by confocal microscopy 24 h later. Cells were labelled before injection with the green-fluorescent lipid dye Dio Vybrant® which stains cell membranes enabling all cells to be visualized. Scale bar is 400 μm. (E) Incomplete cell visualization within a multicellular spheroid due to its thickness. 10000 U-251 MG cells were labelled with green-fluorescent Dio Vybrant® dye, in suspension to ensure all cells were equally labelled and these were used to form the spheroid. Scale bar is 400 μm. (F) Quantification of cellular fluorescence across the yellow bordered regions in the microdevice and the spheroid as indicated in (D,E).

