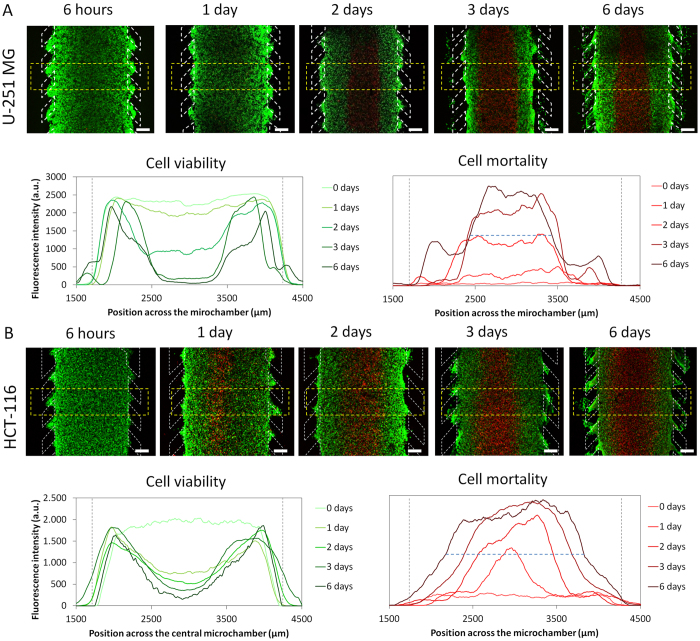
Figure 3. Necrotic core generation within the microdevice.
U-251 MG and HCT-116 cells were embedded in collagen hydrogel in the central microchamber. (A) 40 million U-251 MG cells/ml were confined in the central microchamber and cell viability was evaluated at the indicated times using calcein (CAM) to stain viable cells green and propidium iodide (PI) to stain dead cells red. The graphs show CAM or PI fluorescence intensity profile along the delimited region in the images. Position of the pillars is delimited by a grey dashed line. (B) HCT-116 cells evaluated under identical experimental conditions showed faster necrotic core generation. The width of the necrotic core after 6 days was measured as the distance between those positions in the microchamber that reached 50% of the maximum PI fluorescence intensity (blue dashed horizontal line). Necrotic core width for U251-MG cells was 1011 ± 12 μM, and for HCT-116 cells was 1643 ± 9 μM, p-value < 0.05. Scale bar is 400 μm.

