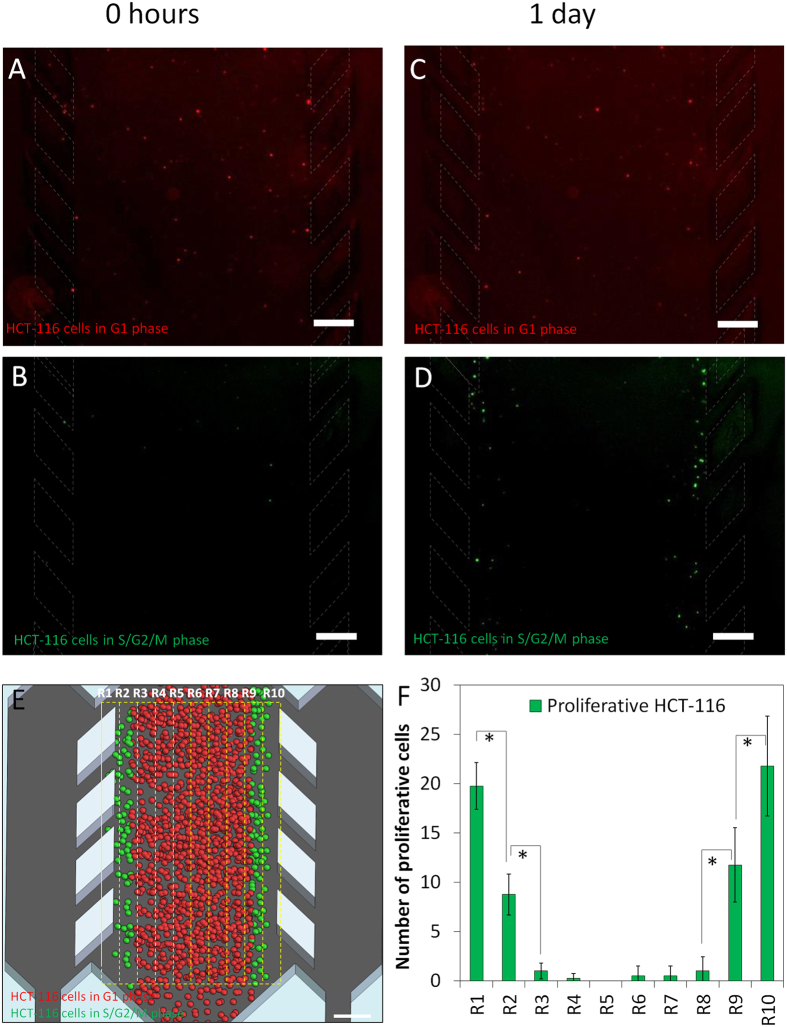
Figure 4. HCT-116 Cell proliferation.
40 million HCT116 cells/ml were confined to the central microchamber; 5% of these cells were transduced with the cell cycle sensor Premo FUCCI®, which stains G0/G1 phase cells in red and S, G2 and M phase cells in green. (A,B) After collagen polymerization, red staining cells (G1 phase or quiescent) were randomly distributed through the central microchamber, whereas only few cells stained green (S, G2 or M phase cells). (C,D) After 24 hours, an increase in green staining cells was clearly observed near the lateral microchannels indicating cell proliferation. (E,F) The central microchamber was vertically divided into ten regions (200 μm steps) and proliferation was quantified as the number of green cells observed in each region at 24 h compared to 0 h. Scale bar is 400 μm.

