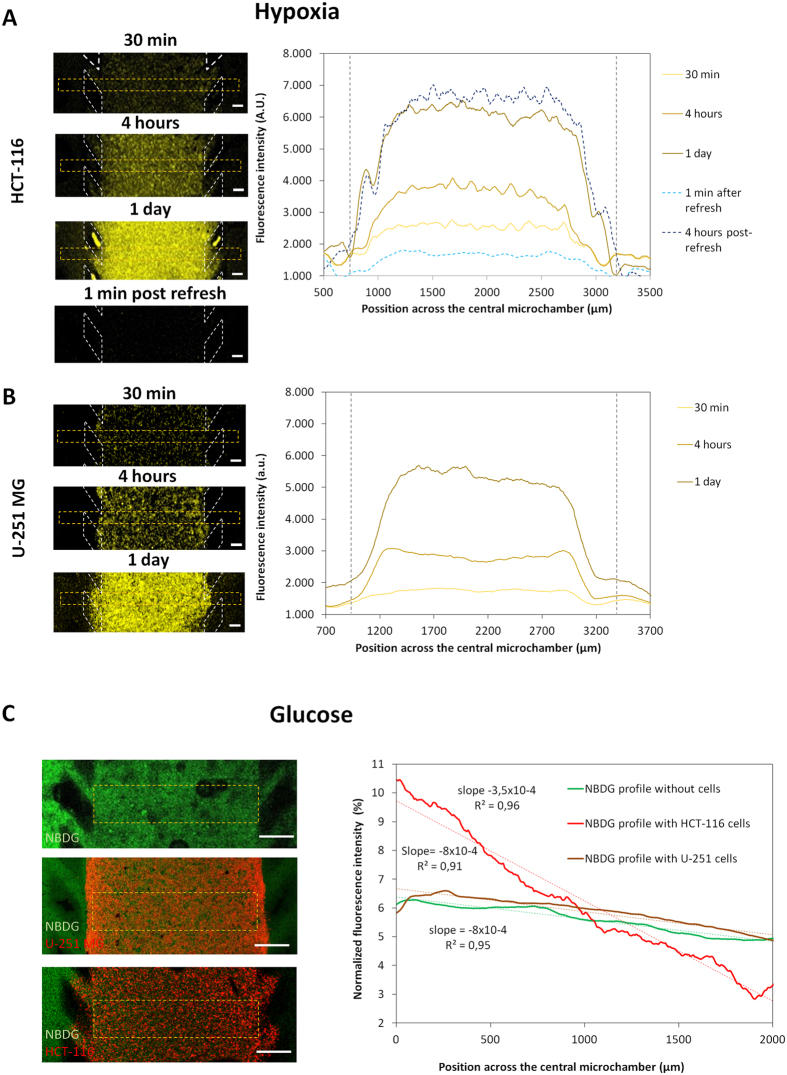
Figure 5. Oxygen and glucose profile.
HCT-116 and U-251 MG cells were embedded within collagen hydrogel and cultured in the central microchamber. (A) A hypoxia-sensing dye was added to the hydrogel/cell mixture prior to injection within the microdevice to monitor and quantify the formation of the hypoxia gradient through the experiment in real-time. After collagen polymerization, culture medium containing the dye was added to the lateral channels to keep the dye concentration constant through the experiment. The left panels show hypoxia-induced fluorescence intensity in the central microchamber increased during the experiment as well as how the hypoxia signal disappeared when medium inside the hydrogel was ‘refreshed’ by interstitial flow. The graph shows the hypoxia-induced fluorescence profile across the central microchamber. The levels of hypoxia rapidly increased across the first 300 μm and reached a plateau in the centre of the microchamber. 1 ml of fresh media perfused through one of the lateral microchannels, reduced hypoxia-induced fluorescence to initial ‘normoxic’ values. 4 hours post-refresh, the hypoxia-induced fluorescence reached again the values observed before. Scale bar is 200 μm. Position of the pillars is delimited by a grey dashed line. (B) The same experiment was repeated for U-251 MG cells with similar effects observed. (C) Green fluorescent glucose analogue (NBDG, 200 μM) was perfused through the left lateral microchannel and the diffusion profile was studied in the absence or presence of cells. The graph shows the NBDG diffusion profile across the central microchamber after 90 min, demonstrating that NBDG was able to penetrate through the collagen hydrogel. The diffusion profile slope was calculated in the absence of cells or in the presence of HCT-116 or U-251 MG cells. Scale bar is 400 μm.

