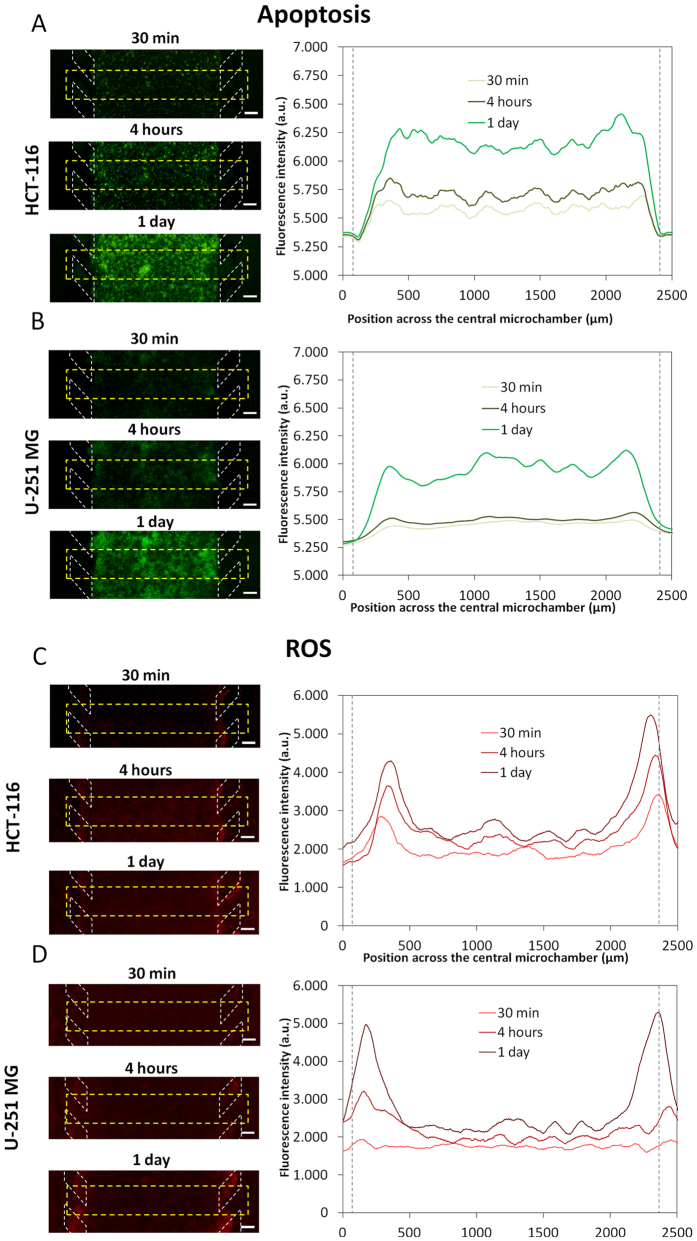
Figure 6. Apoptosis and ROS characterization.
HCT-116 (A) and U-251 MG cells (B) were confined to the central microchamber of the device in hydrogel. An apoptosis sensing dye was perfused into the device via the lateral microchannels. For both cell lines, apoptotic levels were found to increase with time. The graphs show the apoptotic profiles across the delimited region. Position of the pillars is delimited by a grey dashed line. (C,D) For detection and monitoring of ROS production, a commercially available agent that is oxidised by ROS to a fluorescent product was perfused through the system. The graphs show quantification of ROS along the delimited region. Scale bar is 200 μm.

