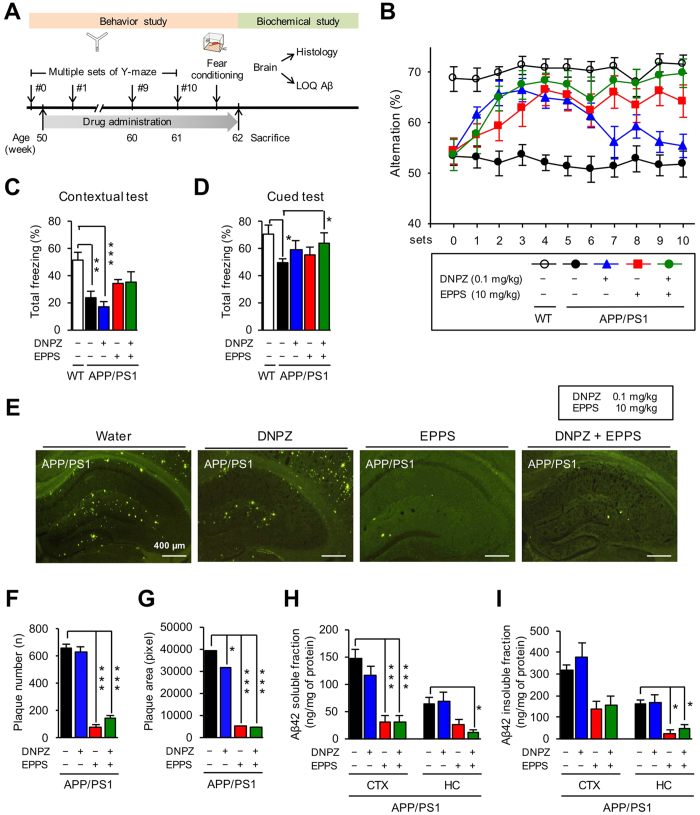
Figure 3. Co-administration of EPPS and donepezil in APP/PS1 double transgenic mice.
EPPS and donepezil (DNPZ) in drinking water were administered to 50-week-old APP/PS1 male mice (water, n = 12; 10 mg/kg/day of EPPS, n = 8; 0.1 mg/kg/day of donepezil, n = 10; and EPPS/donepezil co-administration, n = 9) for 10 weeks and compared to age-matched wild type (WT, n = 19). Y-maze tests were performed at every week for 10 weeks. Then, fear-conditioning tests were performed on week 11, and Aβ plaques and oligomers in brains were stained and quantified by thoflavin-S and ELISA, respectively. (A) Experiment schedule (LOQ: level of quantification). (B) (%) Alternations of Y-maze tests. Multiple sets of Y-maze tests were analysed by two-way repeated measures ANOVA between wild type and APP/PS1 mice with various mixtures of EPPS and donepezil dosages followed by Bonferroni’s post-hoc test (See in Supplementary Table 3 for statistical analyses). (C) Contextual test and (D) cued test of fear-conditioning. (E) Hippocampal region (bregma −1.58~−2.18 mm, 6 slides/mouse) of the mouse brain with thoflavin-S staining (scale bar, 400 μm). (F) Quantifications of number and (G) area of stained Aβ plaques. ImageJ software was used to quantify numbers and pixel areas of Aβ plaques. (H) Quantifications of soluble Aβ42 and (I) insoluble Aβ42 by ELISA analyses (CTX: cortex, HC: hippocampus). Numbers of mice for biochemical analyses are described in Methods. One-way ANOVA with Bonferroni’s post-hoc comparisons were performed in statistical analyses. All the error bars represent the SEMs. (*P < 0.05, **P < 0.01, ***P < 0.001).

