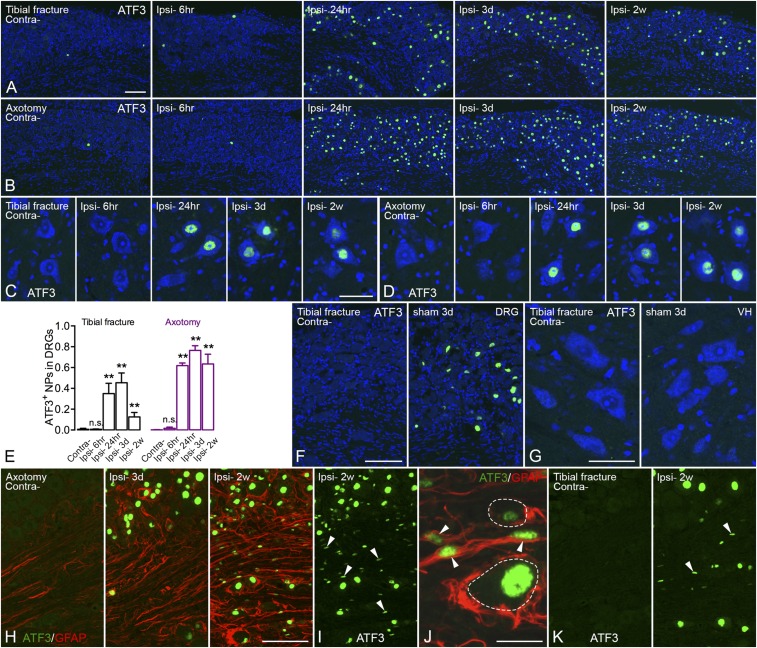
Fig. 2.
Activation of ATF3 in DRGs after unilateral tibial fracture. (A) Expression of ATF3 (green) is induced in DRGs 24 h after tibial fracture and declines after 2 wk, whereas contralateral DRGs do not (or very rarely) express ATF3. (B) Axotomy induces ATF3 expression in a larger population of DRG cells, essentially neurons, after 24 h, and is maintained for at least 2 wk. (C and D) Motor neurons in the spinal ventral horn start to express ATF3 at 24 h, lasting for at least 2 wk in both tibial fracture and axotomy models. (E) Quantification of the number of ATF3-IR neuronal nuclei after tibial fracture and axotomy. (F and G) In the sham group, ATF3 is induced in a small population of DRG neurons but not in spinal motor neurons (3 d). (H) Overview of double labeling with ATF3 (green) and GFAP (red) in DRGs 3 d and 2 wk after axotomy. (I and J) Overview of weakly activated ATF3 (green) in Schwann/satellite cells (indicated by arrowheads) after 2 wk, and high magnification of double labeling of ATF3 (green) and GFAP (red), where arrowheads indicate coexpression. (K) Overview of ATF3 (green) in DRGs after 2 wk of tibial fracture (arrowheads indicate a few rod-shape nuclei, as in I and J). Counterstaining with propidium iodide (blue) (A–D, F, and G). n = 37; n = 4, 5, 4, and 5 for axotomy groups (different time points from shortest to longest, respectively); n = 3, 6, 6, and 4 for tibial fracture groups. Data are represented as mean ± SD. **P < 0.01; analyzed with unpaired t test. n.s., no significant difference. [Scale bars, 100 μm (A and B), 50 μm (C and D), 100 μm (F), 50 μm (G), 100 μm (H, I, and K), and 20 μm (J).]

