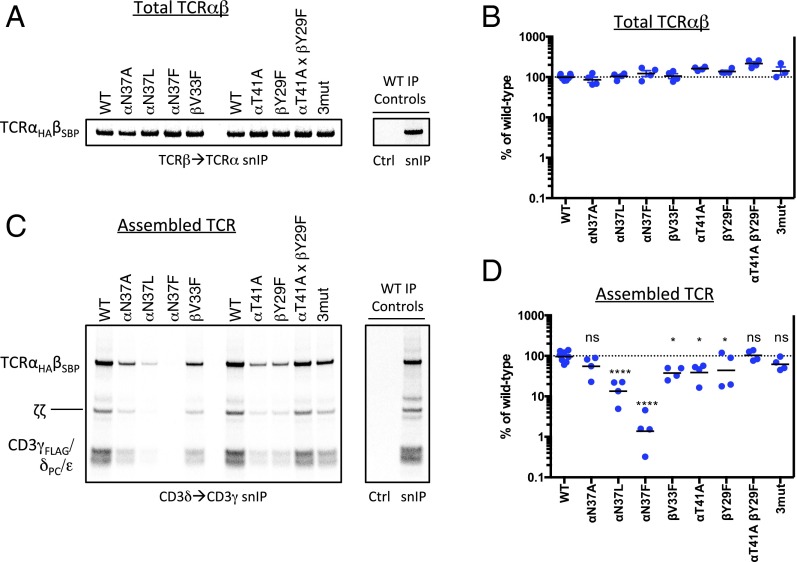
Fig. 6.
Alteration of TCR complex stability by mutations in the C-terminal conserved TCRαβ TM interface. Assembly reactions containing the indicated TCRαβ mutants (on the WT CP region background) were performed as in Fig. 2 but were not subjected to a CuPhe treatment step. All reactions received the same master mix of CD3/ζ mRNAs. Each completed assembly reaction was split for analysis by snIP targeting TCRβ (SBP-tagged) followed by TCRα (HA-tagged) to quantitate total disulfide-linked TCRαβ heterodimer (A), or targeting CD3δ (PC-tagged) followed by CD3γ (FLAG-tagged) to isolate minimally hexameric CD3δε:TCRαβ:CD3γε complexes (C). Control (Ctrl) IPs used isotype-matched irrelevant antibodies or biotin-blocked SA in both steps of the snIP procedure as in Fig. 2. A and C show a single representative experiment. B and D show quantitative analysis of four independent experiments from densitometry data. Each plotted value represents the raw intensity of the TCRαβ band for the mutant, expressed as a percentage of WT in that experiment (an average of two independent WT controls in each experiment). Significance in D was determined in an ordinary one-way ANOVA uncorrected Fisher’s least significant difference test with single pooled variance. Means and P values for each mutant are as follows: (TCRα-N37A) 55.1%, P = 0.1512 (ns); (TCRα-N37L) 13.4%, P < 0.0001; (TCRα-N37F) 1.4%, P < 0.0001; (TCRβ-V33F) 37.6%, P = 0.0188; (TCRα-T41A) 38.9%, P = 0.0231; (TCRβ-Y29F) 43.8%, P = 0.0465; (TCRα-T41A, TCRβ-Y29F) 102.4%, P = 0.8681 (ns); (TCRα-N37A,T41A; TCRβ-Y29F 3mut) 62.0%, P = 0.2562 (ns).

