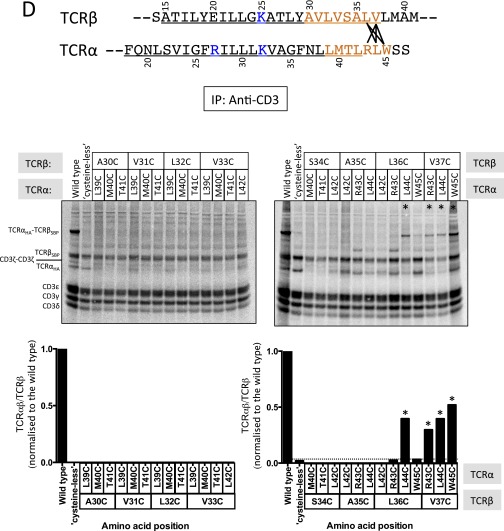
Fig. S2.
Primary disulfide scan of TCRα and TCRβ TM domains. All combinations tested for TCRαβ TM cross-links are shown in A–E. Analysis carried out as described in Fig. 2B with conformation-specific anti-CD3ε (OKT3) IP. The regions being interrogated in each panel are highlighted in orange. Cross-link–positive cysteine mutant combinations are indicated by lines between TCRα and TCRβ TM sequences and with * on the gels and quantitation.


