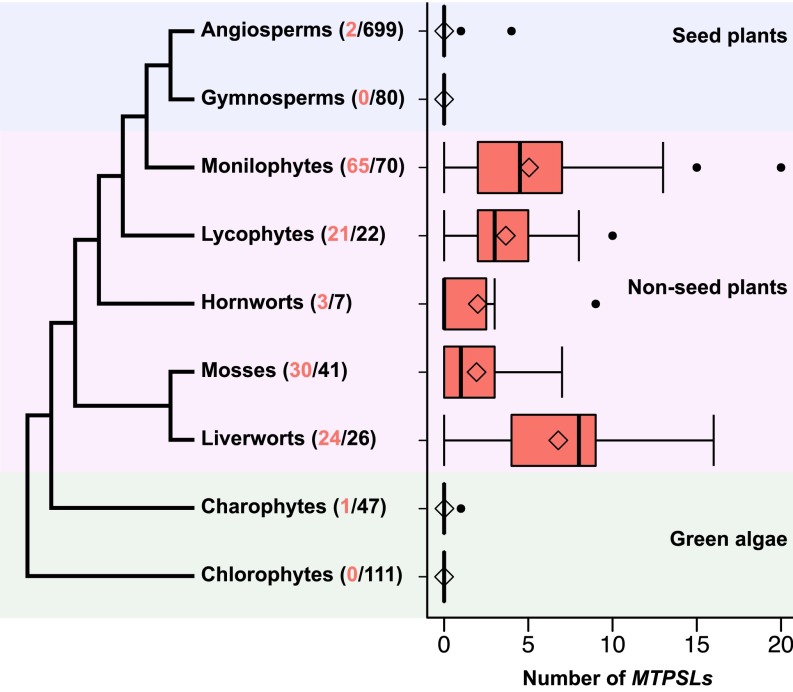
Fig. 1.
Distribution of MTPSL genes identified from the transcriptomes of 1,103 plant species. The numbers in parentheses represent the number of transcriptomes containing putative MTPSLs (in red) and total transcriptomes analyzed in each lineage (in black). The phylogeny of green plants presented was modified from refs. 25 and 26. Each boxplot represents the number of MTPSLs found for individual species in each plant lineage. The solid black lines denote the median number of MTPSLs from each species. Whiskers represent 1.5 times the quantile of the data. Points outside of the range of the whiskers are outliers.

