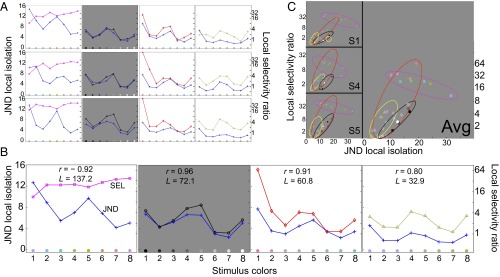
Fig. 4.
Exp. 2: target attention filter local selectivity ratios and target JND isolation for 32 targets and three subjects. (A) Color attention filter local selectivity and color JND isolation (right and left ordinates) as a function of target color (abscissa) for three subjects (rows). In each panel, the blue curve (with data points indicated by +) plots JND isolation (see text for definition). Magenta, black, red, and yellow curves connect selectivity ratios for hue colors, contrasts, RG and BY colors, respectively. From left to right, subfigures are for hue, Bl–Wh, RG, and YB color sets. (B) Average (over the three subjects) selectivity ratios and JND isolations. The correlations r between these two average measures are given in each panel. L is the average overall length in JNDs of the trajectory formed by each set of colors. (C) Scatter plots illustrating the relationship between target JND isolation (abscissas) and target local selectivity ratio (ordinates) for the three subjects and the average. The color of each point indicates the target color. Data points from the same stimulus set are grouped by ellipses colored as follows: hue, magenta; Bl–Wh, black; RG, red; and BY, yellow.

