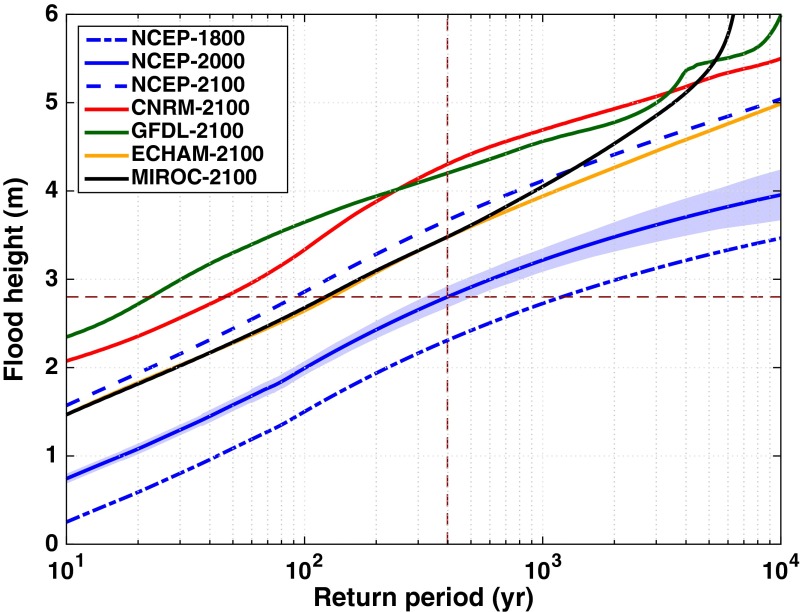
Fig. 1.
Return periods of flood heights (relative to the mean sea level of the baseline year 2000) in NYC, estimated for years 1800, 2000, and 2100. The solid blue curve shows the return period of flood heights (also storm surges as RSL = 0 m) for year 2000, estimated based on NCEP reanalysis. Other solid curves show the return period of flood heights for 2100, based on the projected RSL distributions and surge climatology projected by the various climate models(CNRM-CM3, GFDL-CM2.0, ECHAM5, and MIROC3.2). The dashed blue curve shows the return period of flood heights for 2100 based on the projected RSL of 2100 and the NCEP surge climatology (of 2000, neglecting the change of surge climatology from the baseline). The dash-dotted blue curve shows the return period of flood heights for 1800 based on the estimated RSL of 1800 and the NCEP surge climatology (of 2000, neglecting the change of surge climatology). The blue shading shows the 90% confidence interval of the 2000 NCEP curve (the statistical confidence interval for the other curves is similar). The red dashed lines highlight Sandy’s flood height of 2.8 m (horizontal) and Sandy’s estimated return period in 2000 of 398 y (vertical).

