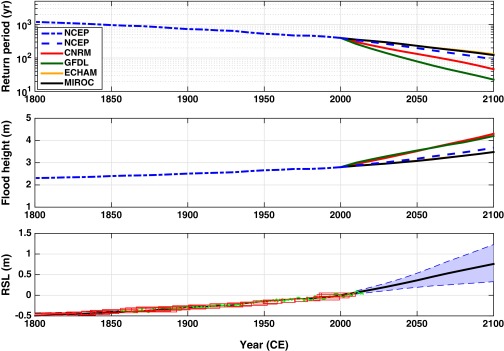
Fig. 2.
Estimated temporal evolution of Sandy’s return period and flood height and of RSL from year 1800 to 2100 (relative to the sea level of the baseline year 2000). (Top) Return period of Sandy’s flood height of 2.8 m. (Middle) Flood height with Sandy’s estimated return period of 398 y (in 2000). As in Fig. 1, solid curves show the estimates accounting for the change in both RSL and surge climatology, and dashed and dash-dotted blue curves show the estimates accounting for only the change in RSL. (Bottom) Estimated past and projected future RSL (black solid curve, mean; shading, 5% to 95% quantile range). Annual mean sea level observed at the Battery tide gauge is shown by the green curve, and the proxy reconstruction from Barnegat Bay is represented by the red rectangles, showing 2σ vertical and geochronological uncertainties.

