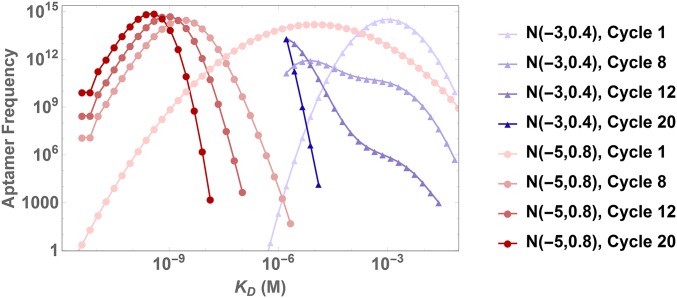
Fig. 2.
Initial distribution affects SELEX dynamics. We plot the distribution of ligand binding affinities with increasing SELEX cycles for the same experimental parameters and two different assumed Gaussian distributions at cycle 1, (blue triangles) and (red dots). The dynamics of the two cases are totally different. For , the distribution shifts to the left and becomes considerably narrower, while for , the distribution additionally skews to the left, such that after cycle 12 the highest affinity binders have outcompeted the rest of the distribution.

