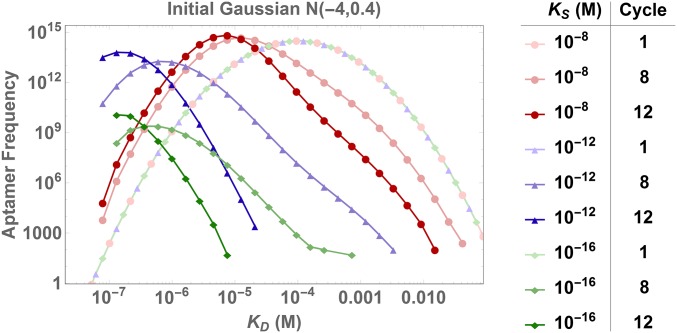
Fig. 6.
Impact of on SELEX dynamics. The plot shows the evolution of distribution for three different values of . Similar to target concentration, we find an optimal outcome in the middle range (, blue), but the outcome for low is not as adverse as for low , because the distribution still shifts toward low with increasing cycles.

