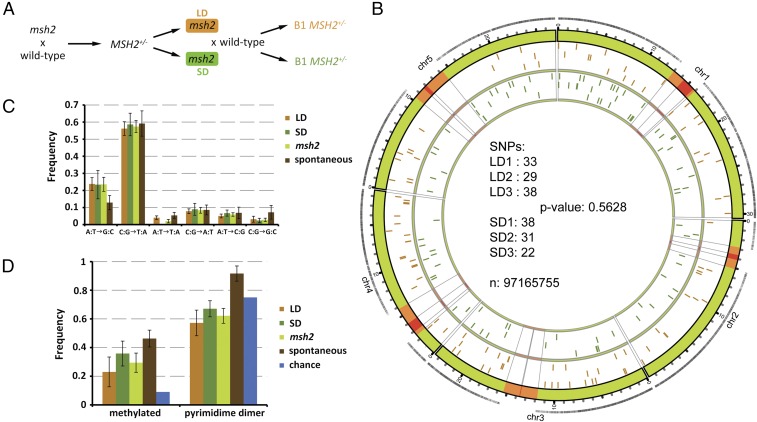
Fig. 2.
Analysis of de novo mutations in LD- and SD-grown msh2 plants. (A) Genetic pedigree of msh2 plants analyzed in this study. Orange and green boxes indicate generation grown at LD and SD, respectively. (B) Number of SNPs in three LD and SD B1 plants and their chromosomal location; n equals the size of our masked genome. Orange regions on the chromosomes represent pericentromeric regions, and red regions the centromeres. Black ticks on the outer orbital correspond to sequence coverage after masking. Orange ticks in the inner orbital represent location of SNPs in LD plants and green ticks in SD plants. (C) Distribution of SNP classes identified and compared with spontaneous mutations (35). (D) Ratio of C:G transitions known to be in methylated DNA (57) or in dipyrimidine dimer contexts.

