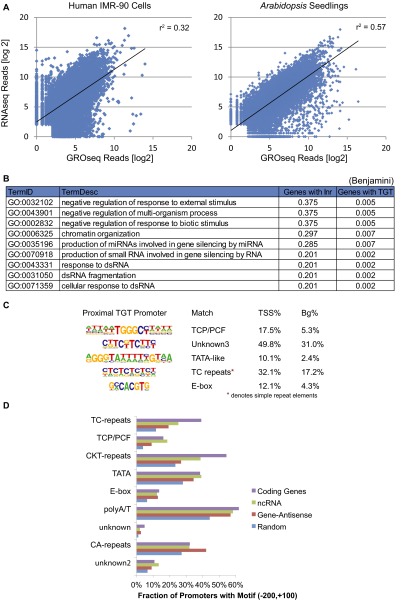
Fig. S5.
(A) RNA stability plot using exons. [log2]-normalized RNA-seq reads vs. [log2]-normalized GRO-seq reads for RefSeq genes in IMR-90 cells (8, 21) and Arabidopsis seedlings. (B) GO analysis of terms enriched for genes with TGT-containing (motif 5) promoters over Inr-containing (motif 1) promoters. (C) Motif finding on TGT-containing promoters. (D) The percentage of promoters containing each motif in the region 200 bp upstream and 100 bp downstream of the TSSs. Each motif was analyzed for the transcript classes of coding genes (purple), noncoding transcripts (green), and gene-antisense transcripts (red) as well as a random genomic regions as a control (blue).

