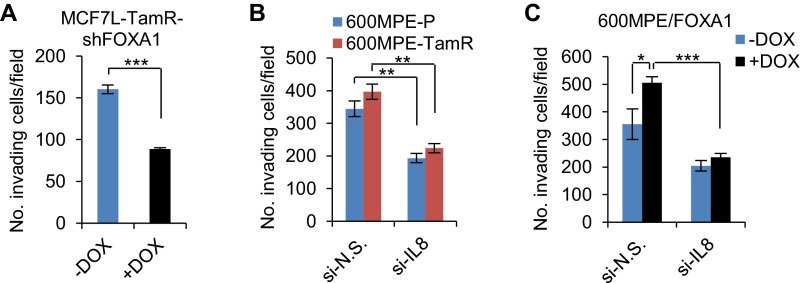
Fig. S9.
Cell invasion upon FOXA1 or IL-8 knockdown. (A) Cell invasion measurement in MCF7L-TamR cells with inducible FOXA1 knockdown. Cells at the same number were seeded onto Matrigel-coated 24-well Transwell plates for 48 h. Invading cells were stained and counted under a microscope. (B) Cell invasion in 600MPE-P and TamR cells transfected with N.S. or IL-8-targeting siRNAs. (C) Cell invasion in 600MPE/FOXA1 cells ± Dox with siRNA knockdown of N.S. or IL-8. Data are presented as means ± SEM of invading cells per field from a total of nine random observed fields. *P < 0.05, **P < 0.01, ***P < 0.001, two-sided t test for indicated comparisons.

