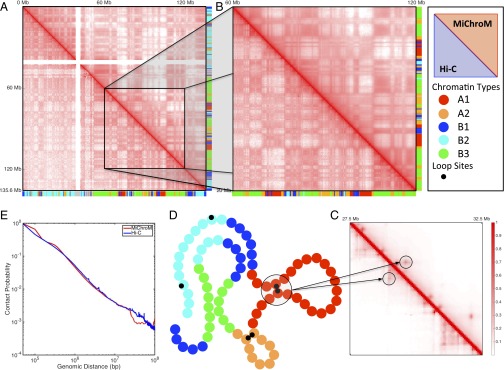
Fig. 1.
Contact maps obtained by computational modeling using MiChroM closely reproduce experimental maps obtained using the Hi-C protocol. (A–C) Contact probability map of chromosome 10 of B-lymphoblastoid cells (GM12878). The map obtained from MiChroM is shown in the upper diagonal section of each map, whereas the lower diagonal region shows the maps reported by Rao et al. (9). A symmetrical figure indicates that the experimental data are reproduced well. Color bars on axes show the chromatin-type sequences of chromosome 10. (A) Complete contact map of chromosome 10 (log scale). (B) Magnification of the 60- to 120-Mb region of chromosome 10 (log scale). At this magnification, the relationship between chromatin types and spatial proximity is clearly visible; for example, it is easy to see that contacts between B-type loci are more frequent than contacts between B-type and A-type loci. MiChroM accurately reproduces the pattern of contacts measured by Hi-C. (C) Further magnification of the 27.5- to 32.5-Mb region (linear scale). The peaks in contact probability characterizing the loops are clearly visible in both experimental and computational maps (more details are provided in SI Appendix). (D) Schematic representation of MiChroM. Each bead represents 50 kb of chromatin belonging to one single chromatin type represented by its specific color as in the color bars of A and B. A smaller black bead marks the location of loop sites. (E) Probability of contacts as a function of genomic distance from experiment and in silico.

