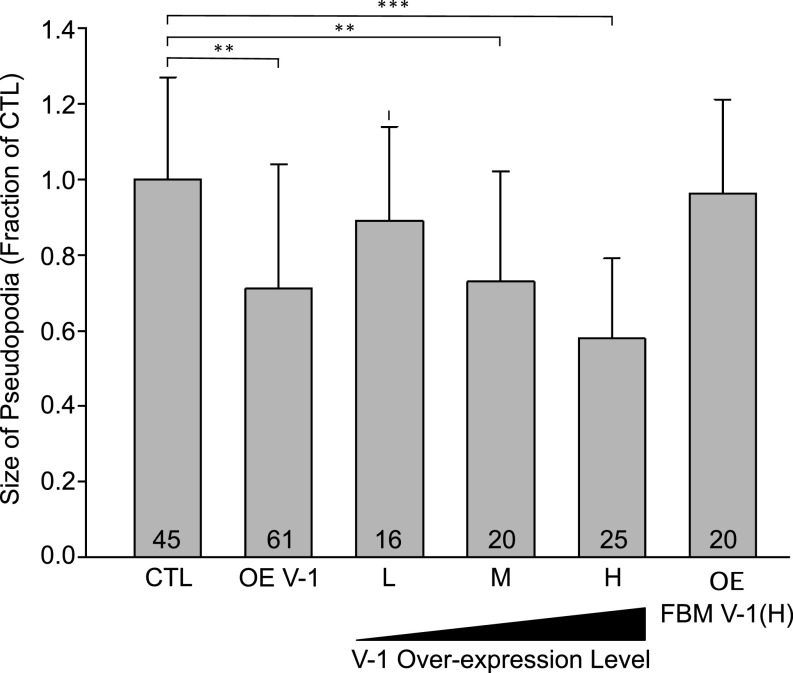
Fig. 3.
V-1 overexpression reduces pseudopodial area in a dose-dependent fashion. Shown is the size of pseudopodia (as a fraction of control cells; CTL) for pooled overexpressing cells (OE-V-1), cells overexpressing L, M, and H levels of mRFP-V-1, and cells overexpressing H levels of mRFP-FBM V-1 [OE FBM V-1 (H)). Mean and SD values are as follows: CTL, 1.00 ± 0.27; OE V-1, 0.71 ± 0.33; L, 0.89 ± 0.25; M, 0.73 ± 0.29; H, 0.58 ± 0.21; OE FBM V-1 (H), 0.96 ± 0.25. Additional statistically different values are as follows: L vs. M, P < 0.05; L vs. H, P < 0.01; M vs. H, P < 0.05. Note that V-1–null cells exhibited a value of 0.94 ± 0.29, which was not significantly different from CTL. **P < 0.01; ***P < 0.001.

