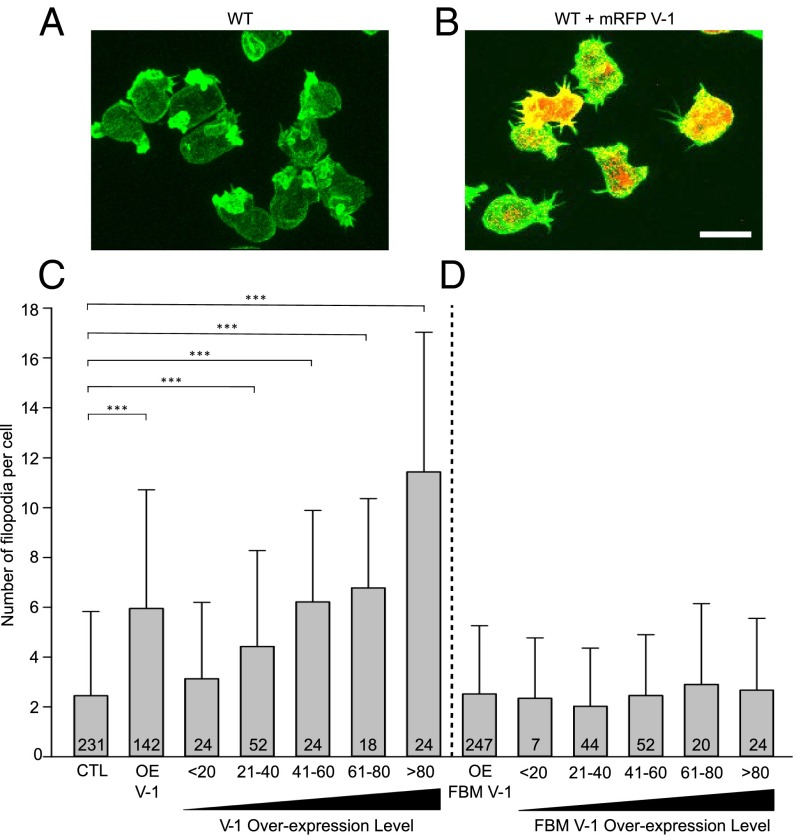
Fig. 5.
V-1 overexpression increases the number of filopodia. (A and B) Representative control cells (A) and cells overexpressing mRFP-V-1 (B) fixed and stained with Alexa Fluor 488-labeled phalloidin. Z-stack projections in the green (phalloidin) and red (mRFP-V-1) channels are superimposed. (Scale bar, 10 µm.) (C) Number of filopodia per cell in control cells (CTL), pooled mRFP-V-1 overexpressing cells (OE V-1), and mRFP-V-1 overexpressing cells binned for increasing V-1 expression level (<20, 21–40, 41–60, 61–80, and >80). Mean and SD values are as follows: CTL, 2.45 ± 3.38; OE V-1, 5.99 ± 4.32; <20, 3.13 ± 3.07; 21–40, 4.42 ± 3.86; 41–60, 6.21 ± 3.68; 61–80, 6.78 ± 3.59; >80, 11.43 ± 5.59. (D) The number of filopodia per cell in pooled mRFP-FBM V-1–overexpressing cells (OE FBM V-1), and mRFP-FBM V-1–overexpressing cells binned for increasing V-1 expression level. Mean and SD values are as follows: OE FBM V-1, 2.57 ± 2.92; <20, 2.31 ± 1.98; 21–40, 2.52 ± 2.34; 41–60, 2.55 ± 2.89; 61–80, 2.48 ± 3.24; >80, 2.67 ± 2.89. Note that V-1–null cells exhibited a value of 2.1 ± 2.59, which was not significantly different from CTL. ***P < 0.001.

