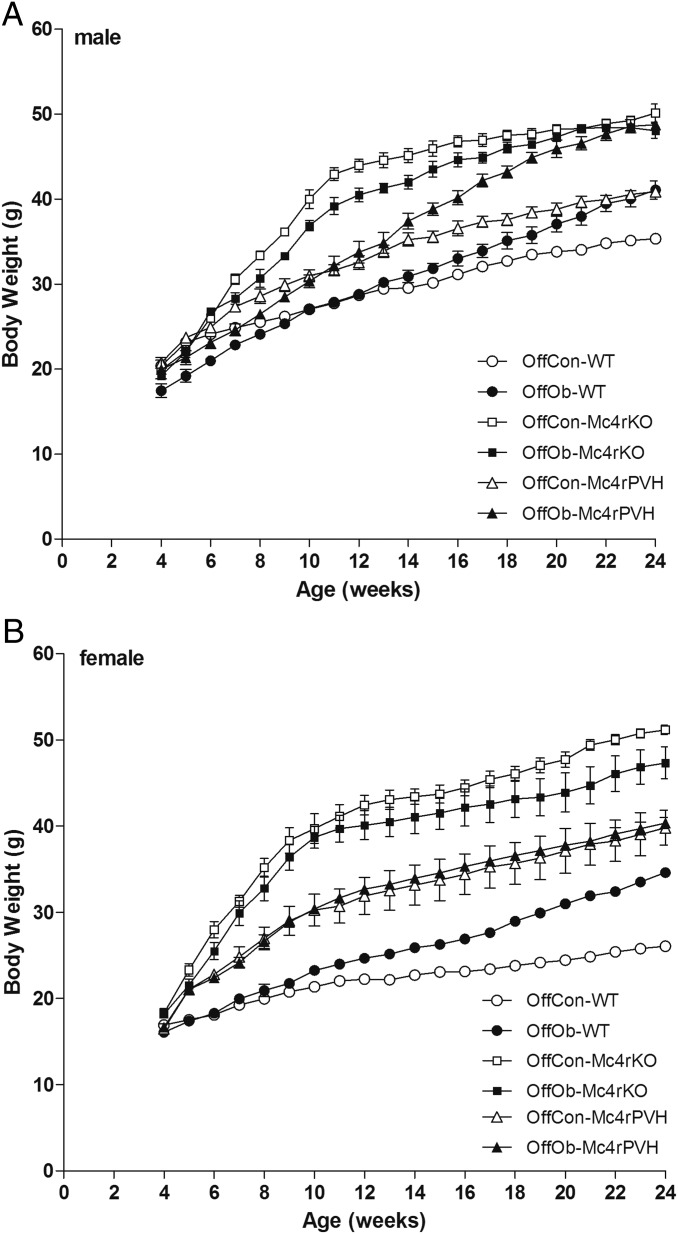
Fig. S4.
Growth curves of male (A) and female (B) OffCon- and OffOb-WT, -Mc4rKO, and -Mc4rPVH mice. Data are expressed as the weekly average per group (n = 5–8; mean ± SEM). Male and female OffOb-WT mice demonstrated increased growth vs. OffCon-WT mice (P < 0.001, repeated measures ANOVA followed by Tukey post hoc test), and male OffOb-Mc4rPVH mice showed increased growth compared with OffCon-Mc4rPVH mice (P = 0.008, repeated measures ANOVA followed by Tukey post hoc test).

