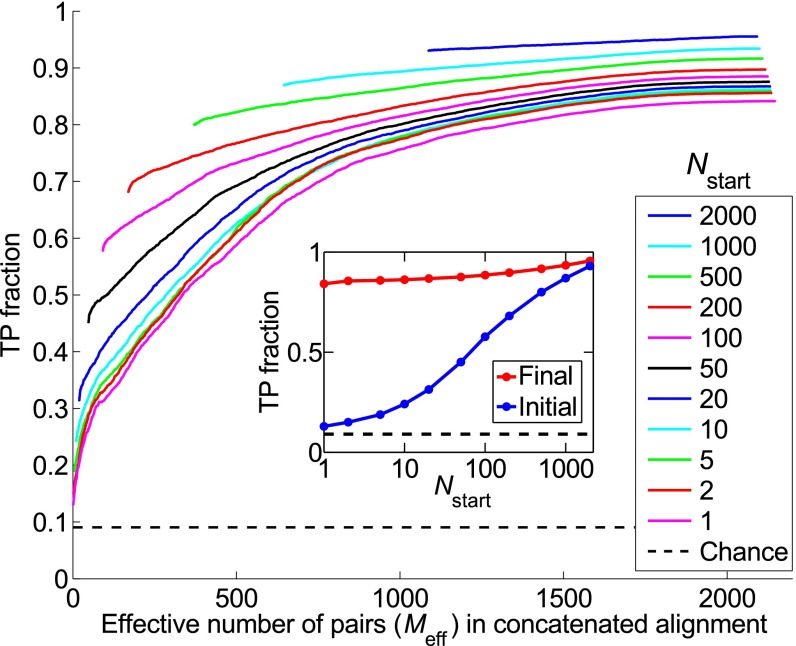
Fig. 2.
Fraction of predicted pairs that are true positives (TP fraction), for different training set sizes . The progression of the TP fraction during iterations of the IPA is shown. The TP fraction is plotted versus the effective number of HK-RR pairs (; see SI Appendix, Eq. S1) in the CA, which includes additional pairs at each iteration. The IPA is performed on the standard dataset, and all results are averaged over 50 replicates that differ by the random choice of training pairs. The dashed line shows the average TP fraction obtained for random HK−RR pairings. (Inset) Initial and final TP fractions (at first and last iteration) versus .

