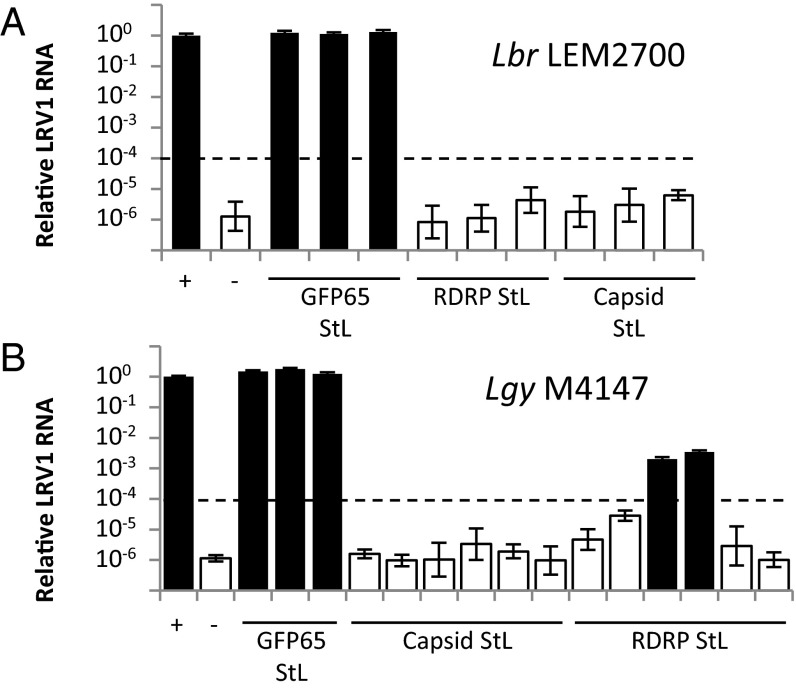
Fig. 5.
The LRV1 genome is completely lost in most LRV1-StL transfectants. qPCR analysis of LRV1 RNA levels in LRV1 StL transfectant clones of Lbr LEM2700 (A) and Lgy M4147 (B), along with positive and negative controls (+ and –, respectively) and control GFP65 StL transfectants. White bars denote a nonspecific qPCR product whereas black bars denote an LRV1-specific amplicons (melt curve analysis). Dashed line indicates the cutoff for designating a clone as LRV1-negative. Error bars are the SD of three technical replicates for each line.

