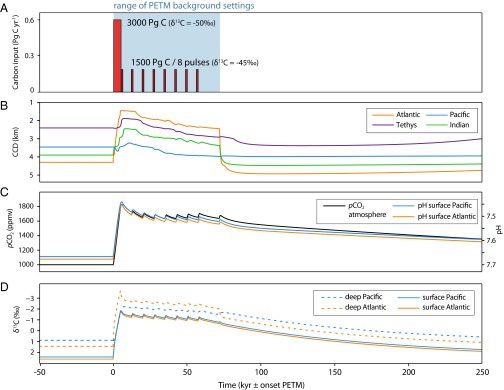
Fig. 4.
LOSCAR model output of pulsed carbon release. (A) Emission scenario showing the release of carbon with eight distinct pulses of 187.5 Pg over 1 kyr each following an initial release of 3,000 Pg over 5 kyr. Selected background conditions were changed during the PETM body and are highlighted in blue (SI Text). (B) Response of CCD in different ocean boxes. (C) Response of δ13C of dissolved inorganic carbon in different ocean boxes. (D) Response of atmospheric CO2 concentrations in parts per million and pH of different ocean boxes.

