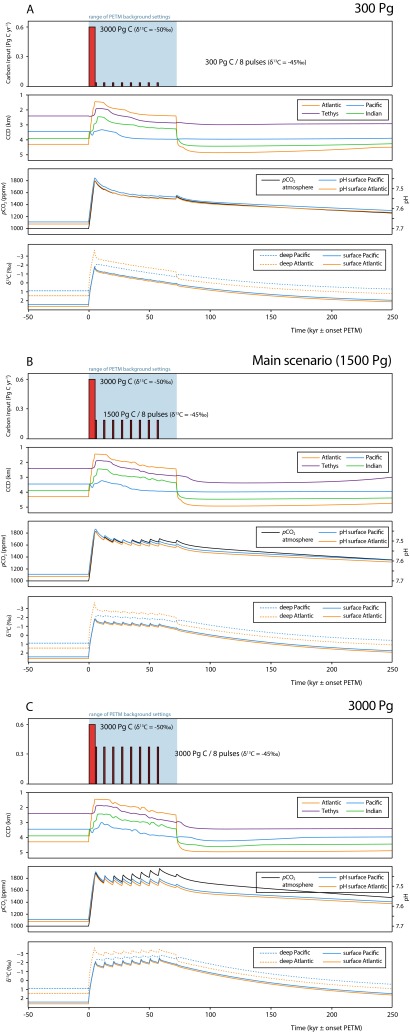
Fig. S7.
LOSCAR model output of variable carbon release during the body of the CIE (300, 1,500, and 3,000 Pg) in eight pulses, showing CCD, pCO2 and pH, and δ13C change in different ocean boxes. (A) Emission scenario showing the release of 300 Pg of carbon. (B) Same for 1,500 Pg (see also Fig. 4). (C) Same for 3,000 Pg.

