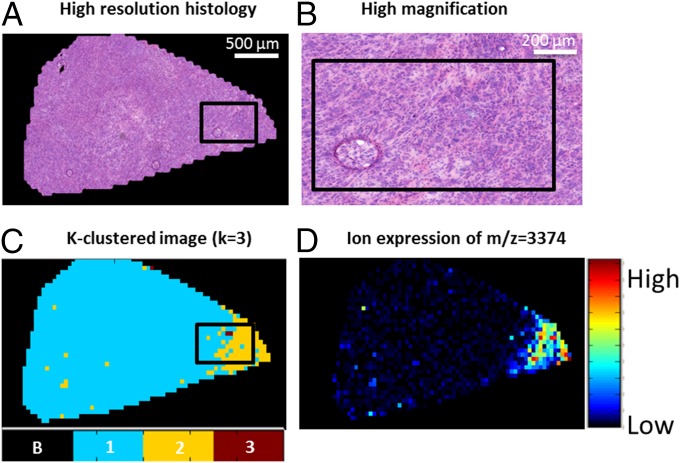
Fig. 5.
Comparison of tissue histology and MSI of α-defensin protein ion detected at m/z 3,374. (A) Histological image of a tissue section from a patient with gastric cancer. (B) Higher-magnification image of a selected region in A showing uniform histology. (C) Close-up of a tissue section in the k = 3 discrete approximation of the 63-tumor sample t-SNE image, showing the presence of the poor survival subpopulation (cluster number 2, yellow). (D) MSI of the α-defensin protein ion detected at m/z = 3,374 showing heterogeneity within the histologically uniform tissue, in which it is highly expressed in the poor-survival subpopulation.

