
Figure 7.
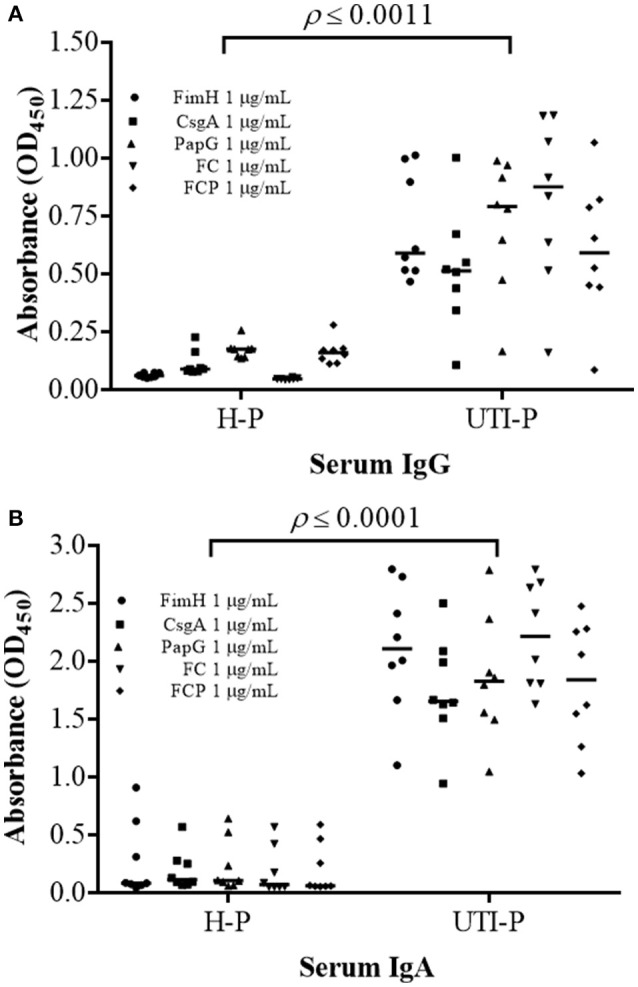
Detection of IgG and IgA antibodies in the sera of patients with UTIs. (A) A significant increase (p ≤ 0.0011) in IgG antibodies in UH-sera was detected compared to the values for IgG antibodies in HP-sera. (B) IgA antibodies in UP-sera were significantly increased (p ≤ 0.0001) compared with IgA antibodies in HP-sera. ELISA was performed in triplicate using three different samples, and 1 μg/mL each protein was used. The points represent individuals, and the bars represent the median.